A crypto research workflow does not need twenty dashboards, several paid subscriptions, or hours of daily analysis. What it needs is structure.
Many investors research crypto in the wrong order. They discover a token through social media, check the chart, read a few bullish posts, look at one or two on-chain metrics, and then form a conclusion. The problem is not that these sources are useless. The problem is that the process is unstructured.
A better crypto research workflow moves from a clear question toward progressively stronger evidence. It combines market context, blockchain verification, on-chain analytics, liquidity analysis, wallet behavior, protocol fundamentals, and portfolio risk.
The goal is not to predict every market move. It is to reduce avoidable mistakes and make uncertainty easier to manage.
A useful workflow should help answer practical questions:
- What exactly am I researching?
- What drives demand for this asset or protocol?
- Is activity genuinely growing?
- Is the liquidity strong enough to enter and exit?
- Are the reported metrics supported by other signals?
- Is growth organic or incentive-driven?
- What risks could invalidate the thesis?
- How much exposure should the portfolio take?
This article presents a practical seven-step crypto research workflow that beginners and intermediate investors can repeat without overcomplicating the process.
Table of Contents
Why Crypto Research Becomes Disorganized
Crypto produces too much information.
Investors have access to price charts, social media feeds, transaction data, wallet alerts, protocol dashboards, token unlock calendars, developer metrics, stablecoin flows, exchange balances, fees, revenue, active addresses, and many other indicators.
The difficulty is not access. It is prioritization.
Without a workflow, research becomes random. Investors move from one tool to another, repeat the same checks, focus on whichever metric supports their existing view, and often confuse information volume with research quality.
This creates several common problems:
- Confirmation bias.
- Overreliance on one metric.
- Repeated research.
- Poor documentation.
- Too many tools.
- Weak comparison between opportunities.
- Emotional decisions.
- No clear risk definition before entering a position.
A structured crypto research workflow reduces those problems by forcing the investor to ask the same core questions in the same order. The quality of research improves when every opportunity is evaluated through a repeatable process rather than a different set of rules each time.
Step 1: Define the Research Question Before Opening a Dashboard
The first step is to define the question.
Many weak research processes begin with something vague such as:
“Tell me everything about this token.”
That question is too broad to guide useful analysis.
A better question could be: “Is this blockchain ecosystem showing sustainable growth?”
Or: “Is this DeFi yield supported by real protocol economics?”
Or: “Does this token have enough liquidity for my position size?”
A clear question determines which metrics matter.
For ecosystem growth, relevant signals may include:
- Active users.
- User retention.
- Stablecoin liquidity.
- TVL.
- DEX volume.
- Fees.
- Revenue.
- Developer activity.
- Application diversity.
- Liquidity depth.
For a DeFi protocol, the focus may shift toward:
- TVL quality.
- Deposit trends.
- Revenue.
- Yield source.
- Incentives.
- Smart contract risk.
- Liquidity.
- Withdrawal conditions.
- Token structure.
For wallet analysis, the relevant evidence may include:
- Transaction history.
- Token transfers.
- Exchange movements.
- Contract interactions.
- Counterparties.
- Timing.
- Repeated behavioral patterns.
The principle is simple: start with the question, then choose the data.
Do not start with a chart and invent a story around it.
Step 2: Build Basic Market Context
Once the question is clear, the next step is orientation.
At this stage, the goal is not to make an investment decision. It is to understand what is being analyzed.
For a token, basic context can include:
- Current market capitalization.
- Fully diluted valuation.
- Circulating supply.
- Total or maximum supply.
- Trading volume.
- Main trading venues.
- Historical price range.
- Token category.
- Main ecosystem relationships.
Platforms such as CoinGecko are useful for this first layer because they provide market structure, token data, categories, liquidity context, and basic ecosystem information.
Price should remain context, not conclusion.
A token can rise because of speculation, narrative rotation, a low circulating supply, exchange listings, short covering, or market-wide risk appetite. None of those factors automatically proves that the underlying ecosystem or protocol is becoming stronger.
A useful research note can begin with a simple structure:
Asset or protocol:
Category:
Main use case:
Market capitalization:
Main ecosystem:
Research question:
Initial thesis:
This keeps the process focused and makes future comparisons easier.
Step 3: Verify Important Activity With a Blockchain Explorer
The third step is verification.
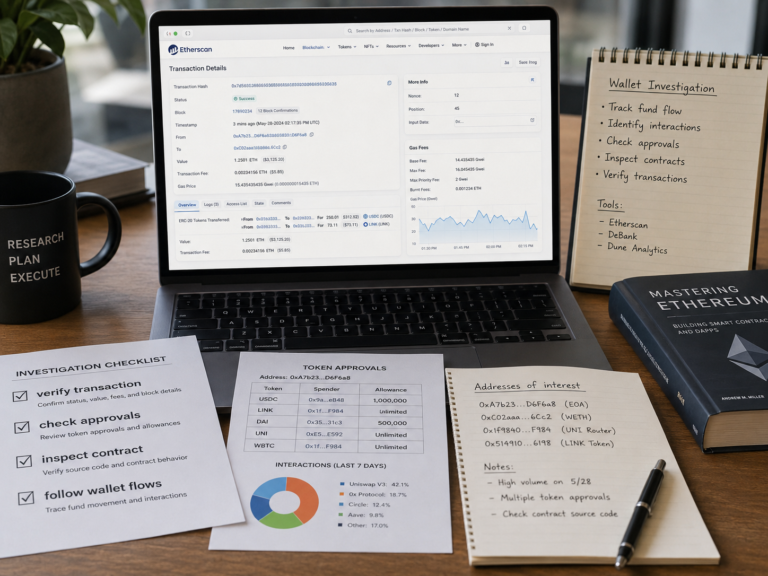
Blockchain explorers help move research from claims to evidence. For Ethereum and other EVM networks, tools such as Etherscan allow users to inspect transactions, wallet balances, ERC-20 transfers, contract interactions, token approvals, gas usage, and transaction status.
The objective is not to inspect everything.
The objective is to verify the specific claim being researched.
For example:
- A project says treasury funds moved: check the wallet.
- A whale alert suggests accumulation: inspect the address history.
- A protocol interaction looks suspicious: review the transaction and contract.
- A token appears unexpectedly in a wallet: verify the contract before interacting.
- A transfer is presented as a sell signal: check where the funds actually went.
This habit is one of the most valuable parts of a crypto research workflow because it separates evidence from commentary.
BlockCodex explains this process in How to Use Blockchain Explorers Like a Pro.
For token-level wallet analysis, see How to Check Token Transfers on Etherscan.
The key rule is straightforward: Do not interpret what you have not verified.
A screenshot can be incomplete. A social media alert can be misleading. A transaction label can lack context. When the decision matters, go back to the underlying activity.
Step 4: Add On-Chain and Ecosystem Context
After verification, the next step is broader analysis.
This is where platforms such as DeFiLlama and Dune become useful.
DeFiLlama can help compare:
- TVL.
- Stablecoin supply.
- DEX volume.
- Protocol fees.
- Revenue.
- Yields.
- Chain-level activity.
- Protocol category growth.
Dune can add custom or community-built dashboards that help investors explore specific protocols, wallets, tokens, ecosystems, or market sectors.
The mistake is opening these tools without knowing what relationship to test.
A stronger workflow connects metrics.
Suppose the research question is whether a DeFi ecosystem is growing sustainably. Instead of checking TVL alone, compare:
TVL + stablecoin liquidity + DEX volume + fees + revenue
If TVL rises while stablecoin liquidity declines, investigate the reason. If DEX volume grows but fees remain weak, review whether the activity is heavily incentivized. If active users rise while retention remains poor, the growth may be temporary.
Several aligned metrics create a stronger case than one impressive chart.
For a practical introduction to analytics platforms, see BlockCodex’s guide on Best On-Chain Analytics Tools for Beginners.
The analytics stage should test whether multiple signals support the same conclusion.
Step 5: Test Liquidity and Exit Conditions
Liquidity should be reviewed before conviction becomes a position.
This is where many research processes become incomplete. Investors spend time evaluating upside but give much less attention to exit conditions.
Before entering a token or DeFi position, ask:
- Where is liquidity located?
- How deep are the main pools?
- Is volume concentrated on one venue?
- What is the likely slippage for the intended position size?
- Is liquidity fragmented across chains?
- Does the position depend on a bridge?
- Are stablecoin exit routes deep?
- What happens during volatility?
- Can reward tokens be sold efficiently?
A token can have a high market capitalization and still have weak usable liquidity. A DeFi protocol can show high TVL while offering poor exit conditions. A yield strategy can advertise an attractive APY while the reward token remains difficult to sell.
That is why BlockCodex separates TVL, volume, liquidity depth, and execution quality across several guides:
What Is Slippage in Crypto and Why It Matters?
Why DeFi Liquidity Looks Strong Until Stress Hits
A good crypto research workflow should always include an exit test.
Ask: “If the thesis is wrong tomorrow, how difficult will it be to leave?”
That question often changes the way risk is evaluated.
Step 6: Separate Observation From Interpretation
This is one of the most important habits in crypto research.
Write down what the data shows before writing what you think it means.
For example:
Observation
Exchange inflows increased over three days.
Weak Interpretation
Investors are about to dump.
Better Interpretation
Exchange inflows increased, which may raise potential sell-side supply. However, the signal should be compared with wallet type, exchange destination, netflows, liquidity depth, and the market’s ability to absorb the flow.
Another example:
Observation
Active addresses increased by 40%.
Weak Interpretation
The ecosystem is gaining real users.
Better Interpretation
Address activity increased, but retention, transaction quality, application distribution, incentives, and bot activity should be reviewed before concluding that user adoption improved.
This distinction matters because investors often convert a metric directly into a prediction.
BlockCodex covers this issue in Why Most Investors Misread On-Chain Data.
A better research sequence is: Data → Context → Interpretation → Decision
That process reduces impulsive conclusions and makes later review much easier.
Step 7: Turn Research Into a Decision Checklist
Research should finish with a decision.
That decision does not always need to be “buy” or “sell.”
It can be:
- Research further.
- Add to a watchlist.
- Wait for better liquidity.
- Reduce position size.
- Monitor one specific metric.
- Enter gradually.
- Avoid the opportunity.
- Reassess after incentives end.
A simple decision checklist can include:
| Research Area | Question |
|---|---|
| Use case | Is there a clear reason for the protocol or asset to exist? |
| Users | Is activity growing and retaining users? |
| Liquidity | Can the position be entered and exited efficiently? |
| Stablecoins | Is usable ecosystem liquidity improving? |
| TVL | Is capital sticky or incentive-driven? |
| Economics | Are fees and revenue supported by real usage? |
| Wallet behavior | Are major flows consistent with the thesis? |
| Token structure | Are supply, emissions, and unlocks manageable? |
| Security | Are contract, approval, and custody risks understood? |
| Portfolio risk | Is the position size reasonable? |
The final decision should then be written in one or two sentences.
For example:
The ecosystem shows improving stablecoin liquidity, DEX activity, and fees, but user retention remains uncertain. I will monitor the trend rather than increase exposure immediately.
That is far more useful than dozens of screenshots with no conclusion.
A Simple Crypto Research Workflow for Beginners
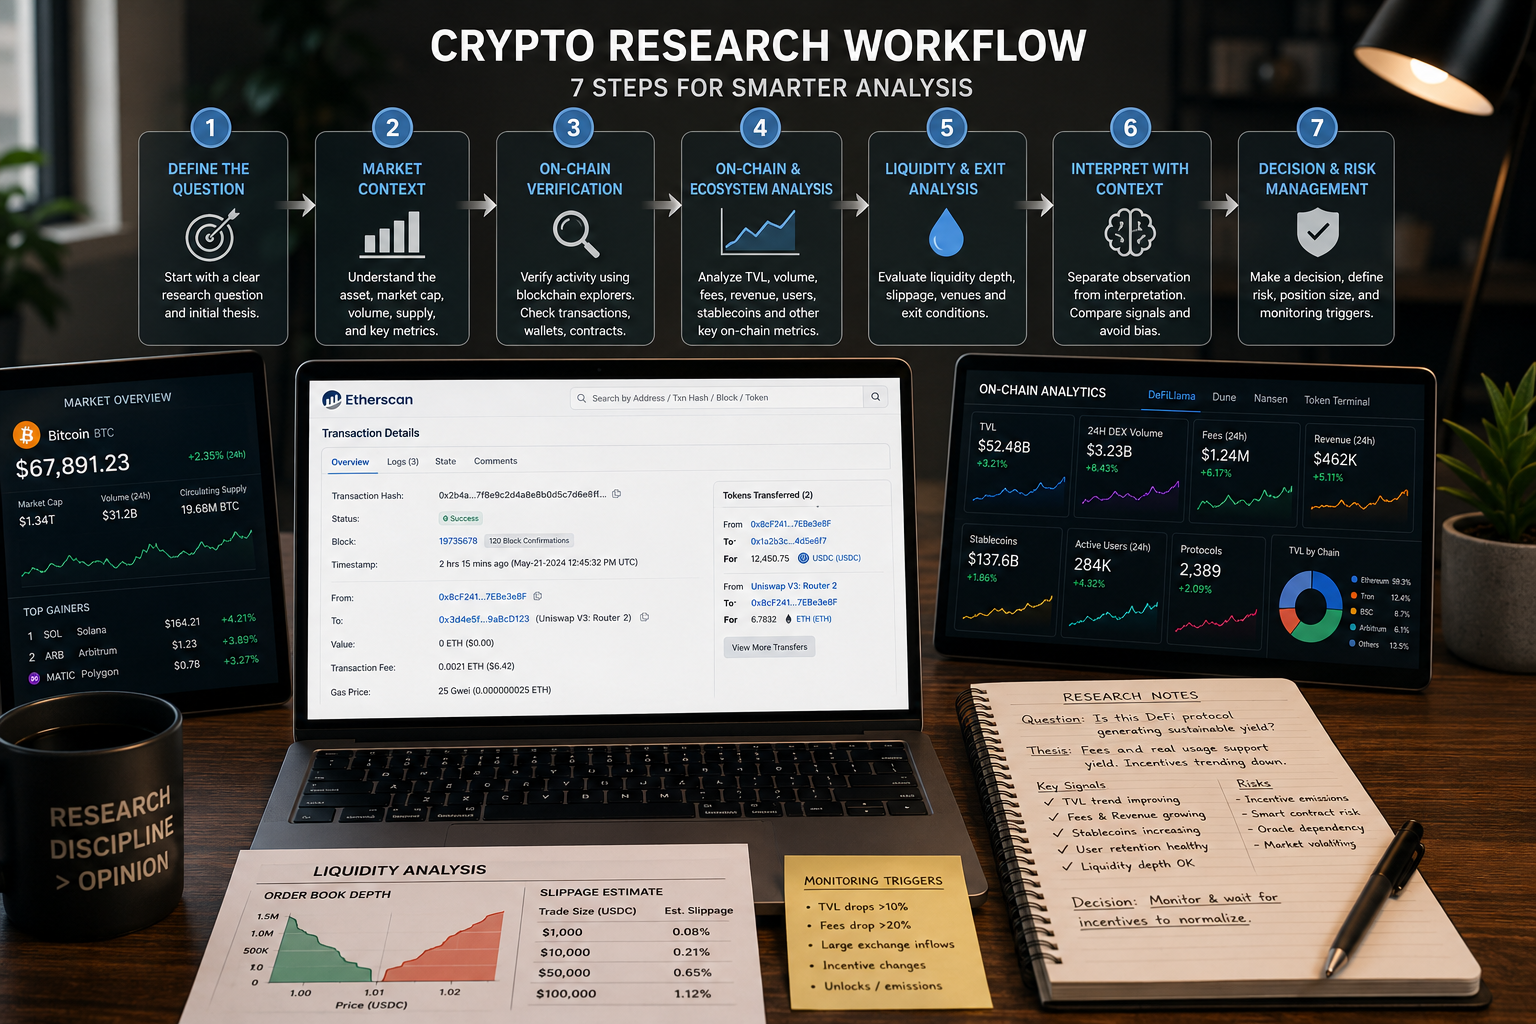
For beginners, the entire process can be reduced to seven stages.
1. Define the Question
Know exactly what you are trying to understand.
2. Check Market Context
Use price, market cap, supply, and volume as orientation.
3. Verify On-Chain Activity
Use a blockchain explorer for transactions, wallets, transfers, and contracts.
4. Compare Broader Metrics
Use analytics platforms for TVL, stablecoins, fees, revenue, users, and protocol activity.
5. Test Liquidity
Check depth, slippage, trading venues, and exit routes.
6. Interpret With Context
Separate what happened from what you think it means.
7. Record the Decision
Write the conclusion, risk, and next monitoring trigger.
This workflow is deliberately simple.
Beginners do not need to study every metric available. They need to build the habit of asking the same questions in the same order.
Example: Researching a Blockchain Ecosystem
Suppose an investor wants to know whether a blockchain ecosystem is genuinely growing.
The research question could be: Is ecosystem growth becoming more durable?
The workflow may then look like this.
Market Context
Check:
- Native token performance.
- Market capitalization.
- Major ecosystem tokens.
- Trading liquidity.
Ecosystem Metrics
Review:
- Active users.
- Transactions.
- Stablecoin supply.
- TVL.
- DEX volume.
- Fees.
- Revenue.
- Application diversity.
Liquidity Context
Check:
- Major DEX pools.
- Stablecoin depth.
- Slippage.
- Lending markets.
- Bridge dependency.
- Liquidity fragmentation.
Growth Quality
Ask:
- Are users returning?
- Are incentives driving activity?
- Is growth spread across multiple applications?
- Are stablecoins entering?
- Are fees improving?
- Are developers still building?
The conclusion should come from the relationship between those signals, not from one metric alone.
For a full ecosystem framework, see How to Tell If a Blockchain Ecosystem Is Growing.
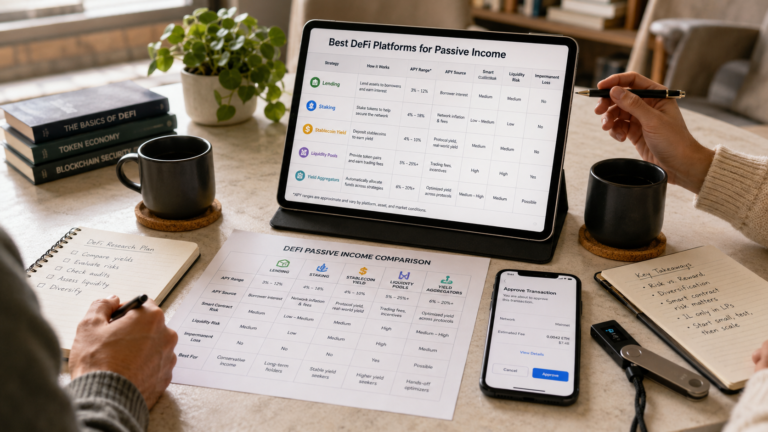
Example: Researching a DeFi Yield Opportunity
The same crypto research workflow can be applied to a yield opportunity.
Suppose a protocol offers an attractive APY.
Do not begin with the APY.
Start with the source.
Define the Yield Source
Ask whether the return comes from:
- Lending interest.
- Trading fees.
- Token rewards.
- Points programs.
- Leverage.
- Restaking.
- Liquidity incentives.
Check Protocol Metrics
Review:
- TVL trend.
- Deposit concentration.
- Fees.
- Revenue.
- Volume.
- Borrowing demand.
- Incentives.
Check Liquidity
Review:
- Pool depth.
- Slippage.
- Reward token liquidity.
- Stablecoin exits.
- Withdrawal conditions.
Check Risk
Review:
- Smart contract exposure.
- Oracle dependency.
- Bridge risk.
- Token approvals.
- Liquidation risk.
Check Portfolio Impact
Ask:
- How much of the portfolio is already exposed to this chain?
- Does the strategy create correlated risk?
- Can the capital be exited quickly?
This approach is more useful than ranking opportunities only by APY.
For a tool-focused risk framework, see Best DeFi Risk Tools for Tracking Yield, Liquidity and Exposure.
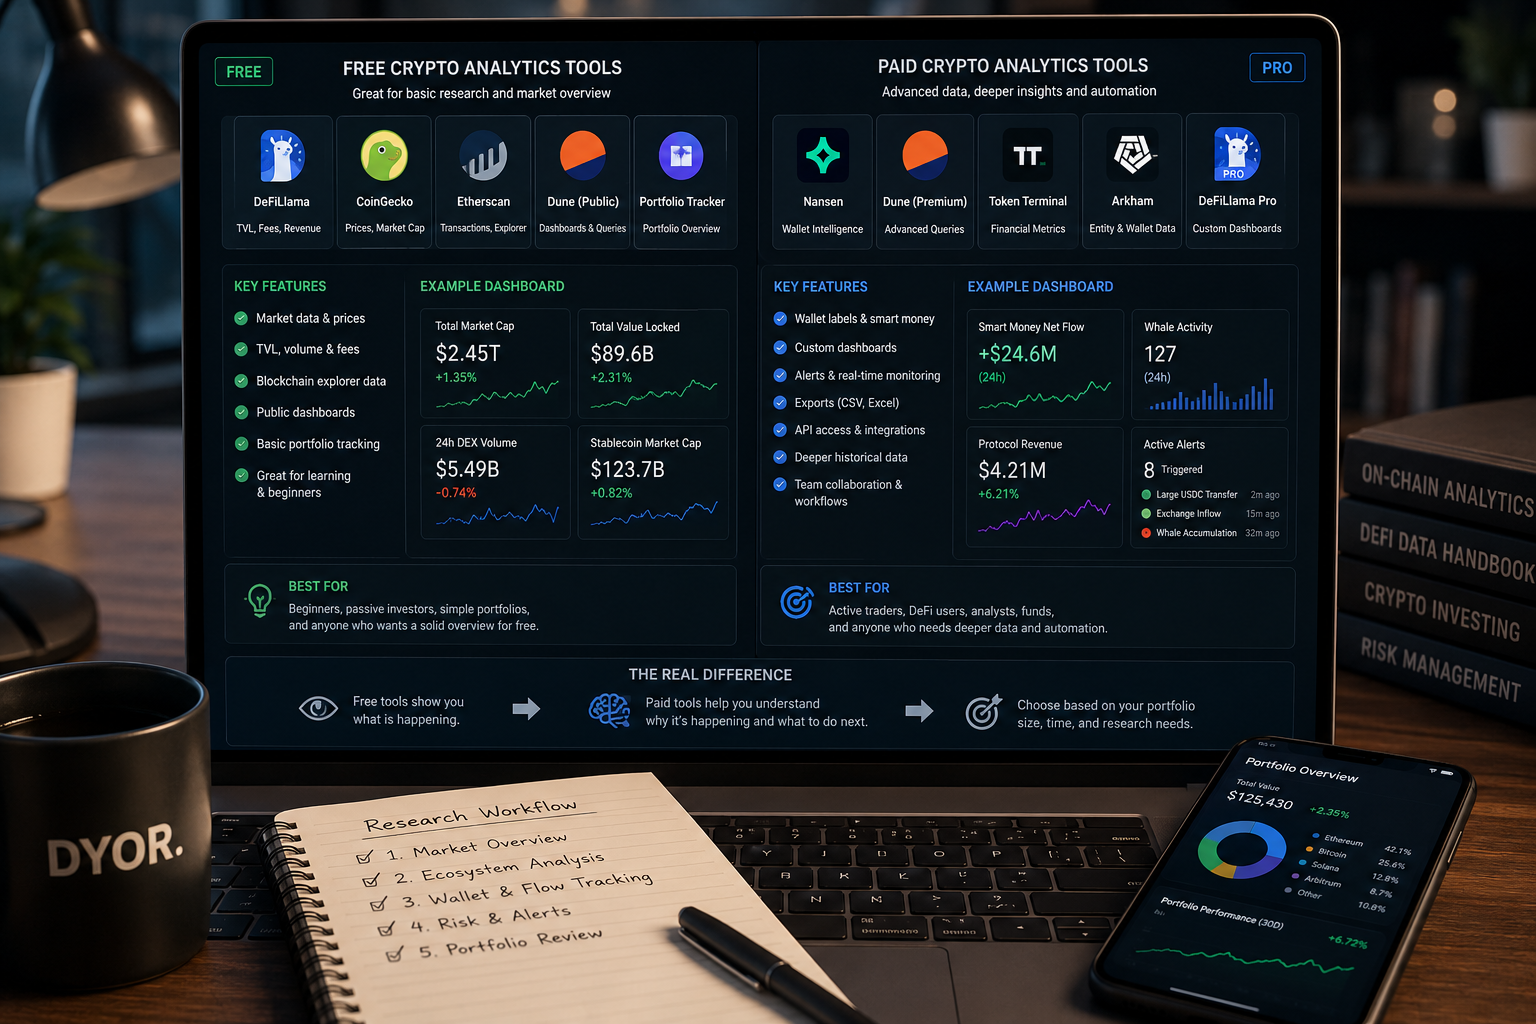
How Many Tools Does a Crypto Research Workflow Need?
Not many.
A practical beginner setup can start with four layers.
Market Data Tool
Use it for price, market capitalization, supply, trading volume, and basic market context.
Blockchain Explorer
Use it for transactions, wallets, token transfers, contracts, and approvals.
Analytics Platform
Use it for TVL, stablecoins, fees, revenue, users, protocol activity, and ecosystem comparison.
Portfolio Tracking System
Use it to track positions, allocation, exposure, and performance.
That is enough for most basic research.
Advanced users can later add:
- Wallet intelligence.
- Smart money tracking.
- Alerts.
- Custom dashboards.
- APIs.
- Data exports.
- Specialized derivatives analytics.
The mistake is adding advanced tools before building basic research discipline.
A stronger tool does not fix a weak question.
How to Organize Research Notes
Research notes should be short enough to review later.
A simple structure works well:
Research Question
What am I trying to determine?
Current Thesis
What do I currently believe?
Evidence Supporting the Thesis
List the strongest data points.
Evidence Against the Thesis
Record contradictory signals.
Main Risks
What could invalidate the idea?
Liquidity and Exit
How can the position be entered and exited?
Monitoring Triggers
What data change would make me reconsider?
Decision
Buy, wait, avoid, monitor, reduce, or research further.
This format prevents research from becoming a collection of links with no conclusion.
It also creates a feedback loop. Investors can compare what they believed before an investment with what actually happened afterward.
That is one of the best ways to improve future decisions.
Common Crypto Research Workflow Mistakes
Mistake 1: Starting With Social Media
Social media can generate ideas, but it should not be the final source of evidence.
Mistake 2: Checking Price Before Fundamentals
Price movement can create emotional bias before the research has even started.
Mistake 3: Using Too Many Tools
More dashboards do not guarantee better analysis.
Mistake 4: Reading Metrics in Isolation
TVL, active addresses, exchange flows, and volume all need context.
Mistake 5: Ignoring Liquidity
A thesis is incomplete without an exit plan.
Mistake 6: Looking Only for Supporting Evidence
Strong research actively searches for evidence that could prove the thesis wrong.
Mistake 7: Failing to Record the Decision
Without notes, investors repeat work and forget why the original decision was made.
A Practical Weekly Crypto Research Routine
A simple weekly routine can keep research organized without requiring constant monitoring.
Portfolio Review
Check allocation, concentration, major price changes, new risks, and DeFi exposure.
Ecosystem Review
Focus only on ecosystems relevant to current positions. Review stablecoin flows, TVL, DEX volume, fees, revenue, and user activity.
Wallet and Flow Review
Look only for meaningful changes such as large exchange inflows, treasury movement, whale activity, or unusual protocol flows.
Risk Review
Ask whether liquidity has weakened, incentives have changed, unlocks are approaching, protocol risk has increased, or the original thesis has changed.
For many long-term investors, this level of structure is enough.
The goal is not to monitor everything.
It is to monitor what could change the decision.
Final Thoughts
A crypto research workflow should make research simpler, not more complicated.
A strong process begins with a clear question and moves gradually toward better evidence. Market data provides orientation, blockchain explorers help verify specific activity, analytics tools reveal broader trends, and liquidity analysis shows whether a position can realistically be entered or exited.
The next step is interpretation. Data becomes useful only when it is placed in context and compared with other signals. The final step is to turn that evidence into a clear decision, a defined risk, and a monitoring trigger.
This seven-step process can be used for tokens, DeFi protocols, blockchain ecosystems, yield opportunities, and wallet activity.
Its main advantage is consistency.
When every opportunity is evaluated through the same structure, weak ideas become easier to identify and strong ideas become easier to defend.
Good crypto research does not eliminate uncertainty.
It makes uncertainty easier to manage.