


Crypto market cycles are often explained through price charts, sentiment, and macro narratives. Prices rise, retail attention returns, leverage expands, and eventually the market resets. That surface-level description is not wrong, but it misses the deeper mechanism.
A crypto cycle is not just a price movement.
It is a rotation of capital, conviction, liquidity, and behavior across different participant groups.
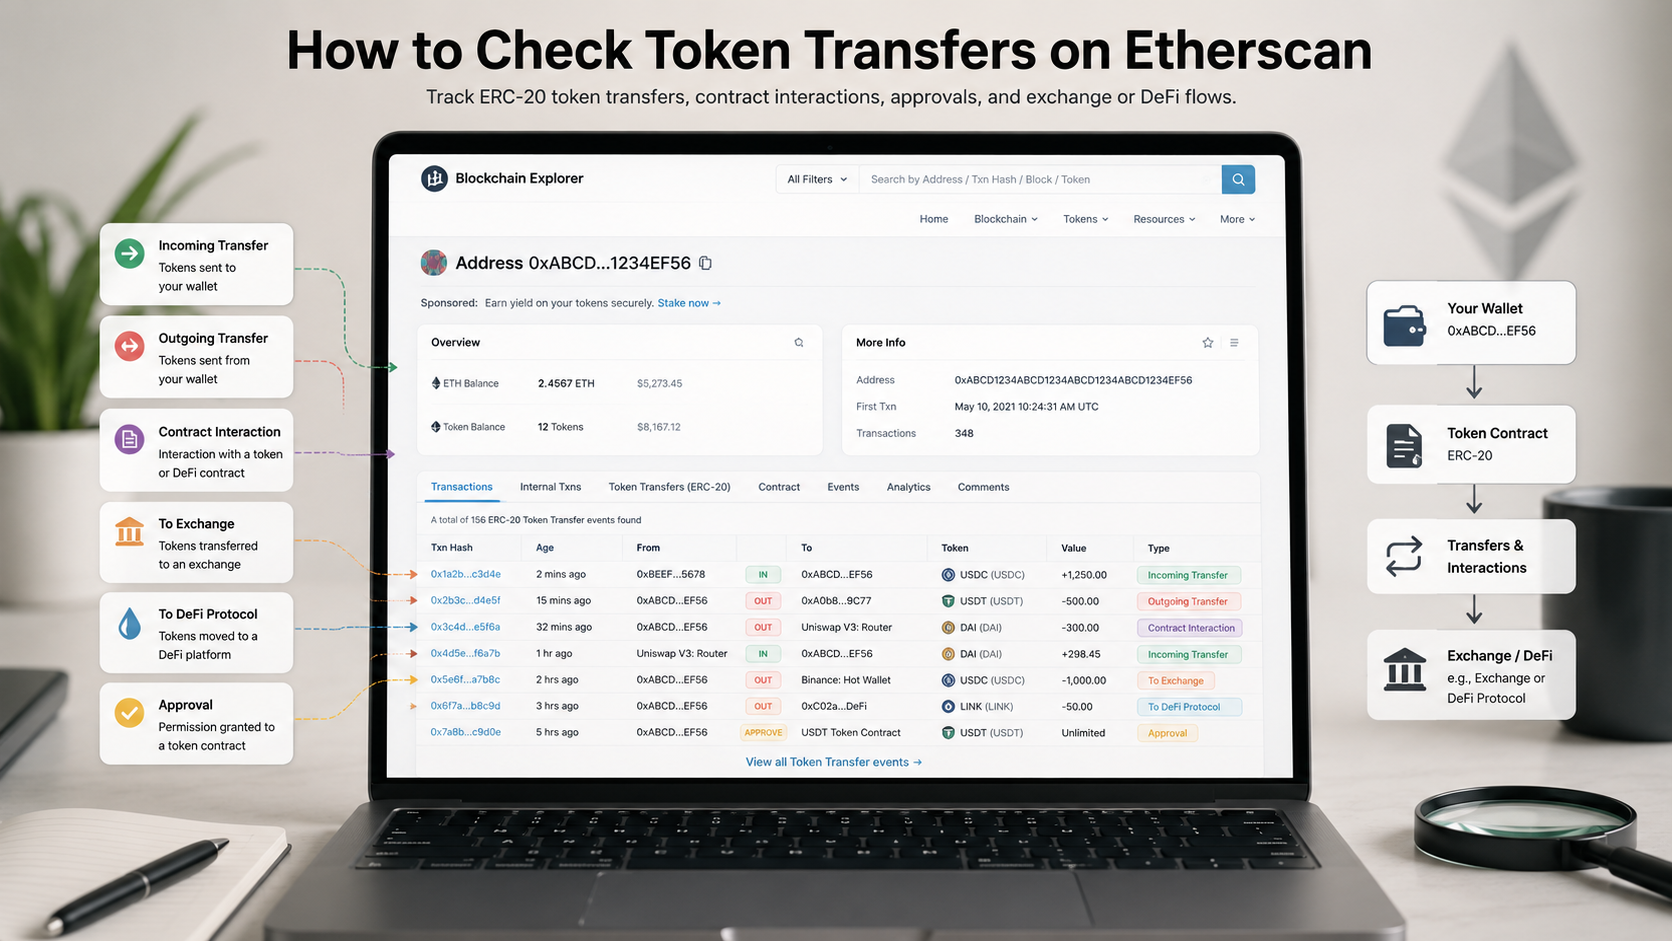
On-chain data helps reveal this structure because it shows what investors actually do with their assets: whether they are holding, selling, accumulating, transferring to exchanges, or moving capital into stablecoins and DeFi.
The goal is not to predict exact tops or bottoms. The goal is to understand which phase the market may be entering and whether price action is supported by real capital behavior.
That makes on-chain data useful for interpreting crypto market cycles more clearly than price alone.
Table of Contents
Why Price Alone Misreads Crypto Market Cycles
Price is the most visible signal in crypto, but it is also one of the noisiest.
A token can rise because of:
- leverage;
- low liquidity;
- short-term narratives;
- exchange listings;
- speculative rotation;
- macro risk appetite.
None of these automatically prove that a cycle is healthy.
A better cycle analysis asks:
- Is new capital entering the network?
- Are long-term holders distributing or accumulating?
- Are short-term holders in profit or under pressure?
- Is liquidity expanding or contracting?
- Is volume supported by real demand or leverage?
This is why on-chain indicators matter. They allow investors to compare price movement with actual network-level behavior.
For a deeper breakdown of how raw blockchain activity should be interpreted, see BlockCodex’s guide: “What On-Chain Activity Really Tells Us About Network Usage.”
The Core Cycle Framework: Accumulation, Expansion, Distribution, Reset
Most crypto market cycles can be simplified into four broad phases.
| Cycle Phase | Typical Behavior | On-Chain Clues |
|---|---|---|
| Accumulation | Long-term investors build positions | Low volatility, rising conviction |
| Expansion | Price and activity rise together | New inflows, higher volume |
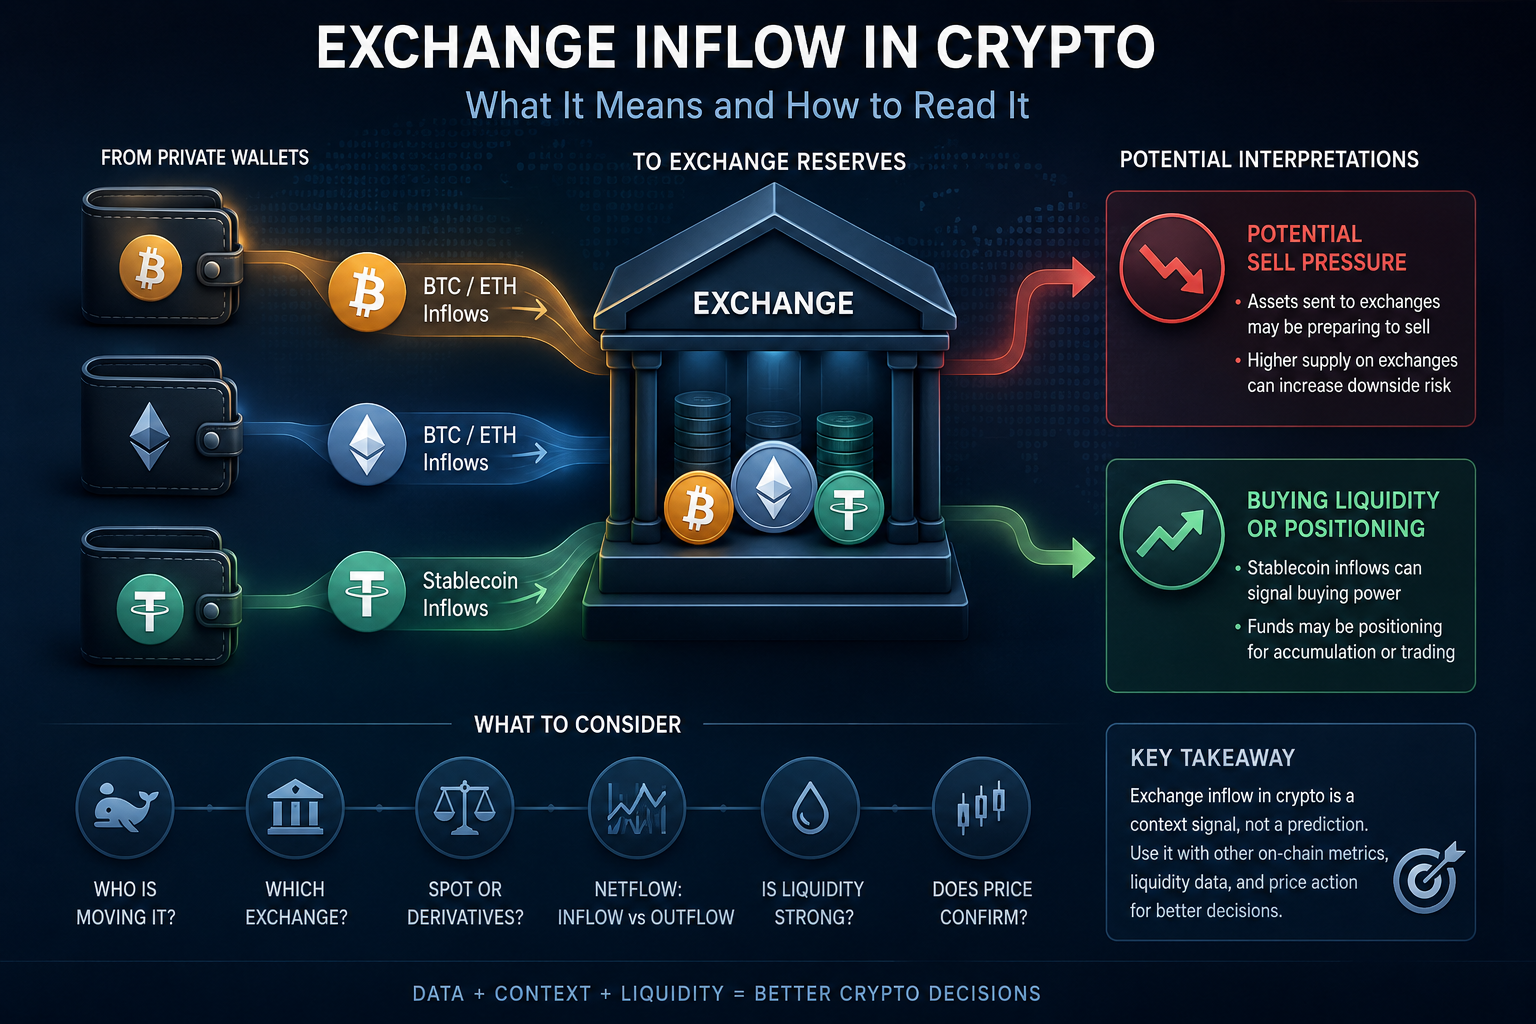
| Distribution | Early holders sell into demand | Profit-taking, exchange inflows |
| Reset | Leverage unwinds and weak hands exit | Realized losses, liquidity contraction |
This framework is not mechanical. Markets can move sideways for months, retest phases, or behave differently across assets. But the structure is useful because it focuses on behavior rather than emotion.
The strongest signal usually appears when multiple data layers align.
For example, rising prices with rising realized cap and stable long-term holder behavior is different from rising prices driven mostly by leverage and thin liquidity.
Realized Cap: Tracking Capital That Actually Entered the Network
One of the most useful on-chain concepts is realized capitalization.
Unlike market cap, which values every coin at the current price, realized cap values each coin at the price when it last moved on-chain. Glassnode describes realized cap as the aggregate value that has flowed into Bitcoin on-chain, minus capital flowing out via realized losses. It tends to move through distinct regimes during market cycles.
This matters because market cap can expand quickly during speculative rallies, while realized cap moves more slowly and reflects actual capital revaluation.
A rising realized cap usually suggests that coins are being repriced at higher levels, often because new buyers are entering and old coins are moving.
A flat or declining realized cap can signal weaker capital inflow or realized losses.
The key insight:
Market cap shows what the market is worth today. Realized cap shows where capital has actually changed hands.
That makes realized cap especially useful during expansion and reset phases.
MVRV: Measuring Unrealized Profit and Cycle Pressure
MVRV compares market value to realized value. In simple terms, it helps estimate whether holders are sitting on large unrealized profits or losses.
Glassnode explains Short-Term Holder MVRV as the ratio between market value and realized value for short-term holders, helping visualize unrealized profitability for that cohort. The average unrealized profit or loss can be interpreted as MVRV minus 1.
This is important because short-term holders tend to be more reactive than long-term holders.
When short-term holders are deeply in profit, the market may become more vulnerable to profit-taking. When they are underwater, selling pressure may increase from panic or forced exits.
MVRV does not produce automatic buy or sell signals. But it helps answer a better question:
Is the market becoming overheated, stressed, or balanced?
For cycle analysis, this is more useful than simply asking whether price is up or down.
Long-Term Holders: Conviction or Distribution?
Long-term holders are one of the most important groups in crypto market cycles.
They often accumulate during weak periods and distribute during strong demand phases. That does not mean long-term holders are always right, but their behavior provides insight into market maturity.
Glassnode defines Long-Term Holder MVRV as MVRV applied to coins aged 155 days or more, using it to assess the behavior of long-term investors.
This metric matters because long-term holders usually represent stronger conviction capital.
When long-term holders continue holding during market expansion, supply can tighten. When they begin distributing heavily into rising demand, the cycle may be maturing.
Investors should avoid simplistic interpretations. Selling by long-term holders is not automatically bearish. In bull markets, distribution is normal. The question is whether demand is strong enough to absorb it.
That is why long-term holder behavior should be read alongside:
- exchange inflows;
- realized profit;
- stablecoin liquidity;
- trading volume;
- derivatives leverage.
One metric alone is not enough.
Stablecoins: The Liquidity Layer Behind the Cycle
Stablecoins are increasingly central to crypto market cycles because they represent usable on-chain liquidity.
When stablecoin supply grows, capital is often preparing to move, settle, trade, lend, or rotate across ecosystems. When stablecoin liquidity contracts, risk appetite may be weakening.
The a16z State of Crypto 2025 report highlighted that adjusted stablecoin transaction volume approached $1.25 trillion in September 2025, and reached $9 trillion over the prior 12 months, up 87% year over year.
This matters because stablecoins are no longer only a trading tool. They are becoming a settlement layer, liquidity bridge, and working capital base for crypto ecosystems.
For crypto market cycles, stablecoins help answer:
- is capital waiting on-chain?
- are users moving into risk assets or staying defensive?
- is liquidity concentrated or broadening?
- are payment and settlement use cases growing separately from speculation?
This is why stablecoin data can reveal cycle structure before price fully reflects it.
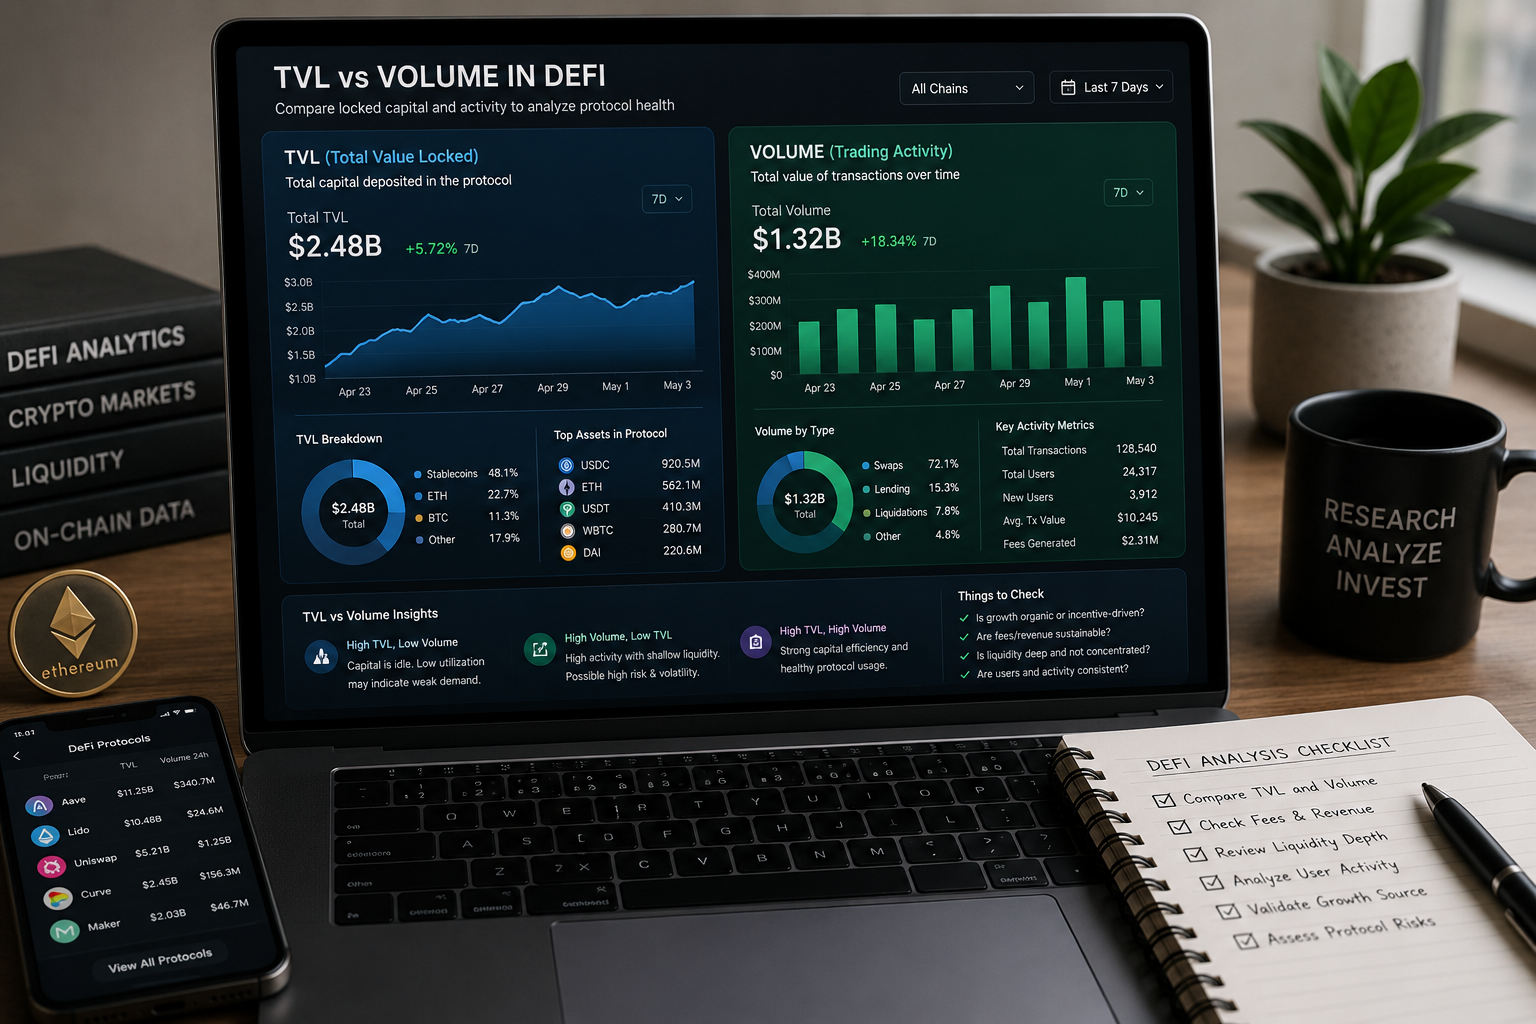
Volume and Leverage: Activity Is Not Always Healthy
High trading volume can look bullish, but volume quality matters.
CoinGecko’s 2025 Annual Crypto Industry Report showed that centralized exchange perpetual volume reached $86.2 trillion in 2025, while decentralized perpetual volume grew 346% to $6.7 trillion.
That scale shows how important derivatives have become in crypto market structure.
But derivatives volume can cut both ways.
It can increase liquidity and enable hedging, but it can also amplify volatility when leverage builds too aggressively. A cycle driven by spot accumulation behaves differently from one driven by leveraged perpetuals.
This is why investors should compare:
- spot volume vs derivatives volume;
- funding rates;
- open interest;
- liquidation clusters;
- exchange inflows;
- stablecoin liquidity.
If price rises while leverage expands faster than spot demand, the move may be more fragile.
For a deeper look at liquidity behavior, see BlockCodex’s article: “Liquidity in Crypto Markets: What Most Investors Misunderstand.”
How On-Chain Data Helps Identify Cycle Transitions
Crypto cycles rarely shift all at once. They transition gradually.
A potential accumulation phase may show:
- low volatility;
- muted retail activity;
- long-term holder accumulation;
- rising realized cap after a drawdown;
- stablecoin liquidity waiting on-chain.
A potential expansion phase may show:
- rising realized cap;
- increasing active users;
- broader liquidity;
- stronger spot volume;
- sustainable application activity.
A potential distribution phase may show:
- high unrealized profits;
- long-term holder selling;
- exchange inflows;
- speculative leverage;
- retail attention returning aggressively.
A potential reset phase may show:
- realized losses;
- falling leverage;
- weak liquidity;
- declining volume;
- short-term holders under stress.
The important point is that on-chain data does not remove uncertainty. It reduces blindness.
It helps investors see whether the market is supported by durable capital or short-term momentum.
Practical Framework for Investors
A simple on-chain cycle dashboard should include:
| Signal | What It Helps Reveal |
|---|---|
| Realized cap | Capital inflow and repricing |
| MVRV | Unrealized profit/loss pressure |
| Long-term holder behavior | Conviction vs distribution |
| Stablecoin supply | Available liquidity |
| Exchange flows | Potential sell pressure |
| Spot vs derivatives volume | Demand quality |
| Active addresses | Network participation |
The mistake is trying to find one perfect indicator.
Crypto market cycles are complex because they combine investor psychology, liquidity, protocol usage, leverage, and macro conditions.
The edge comes from reading multiple signals together.
Conclusion
Crypto market cycles cannot be understood through price alone.
Price shows the result. On-chain data helps explain the behavior behind it.
Realized cap reveals how capital enters and exits the network. MVRV shows unrealized pressure. Long-term holder data helps identify conviction or distribution. Stablecoins reveal liquidity conditions. Volume and leverage show whether activity is healthy or fragile.
Together, these signals provide a stronger framework for interpreting crypto market cycles.
The goal is not to predict every move.
The goal is to recognize when the market is accumulating, expanding, distributing, or resetting — and to understand whether the underlying data supports the narrative.
For investors, that difference matters.
Because in crypto, the most dangerous mistake is not being wrong about price.
It is misunderstanding the cycle behind the price.