


: 5 Key Signals Showing a Market Pause")
Published: March 30, 2026
Data coverage: Week of March 24–30, 2026
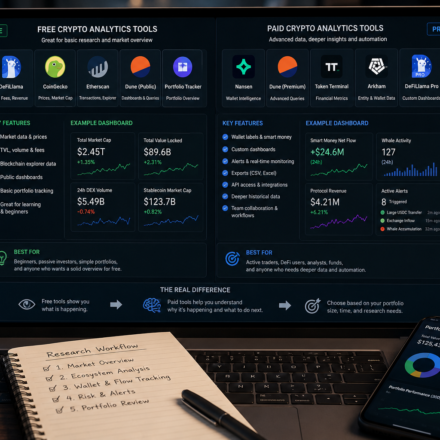
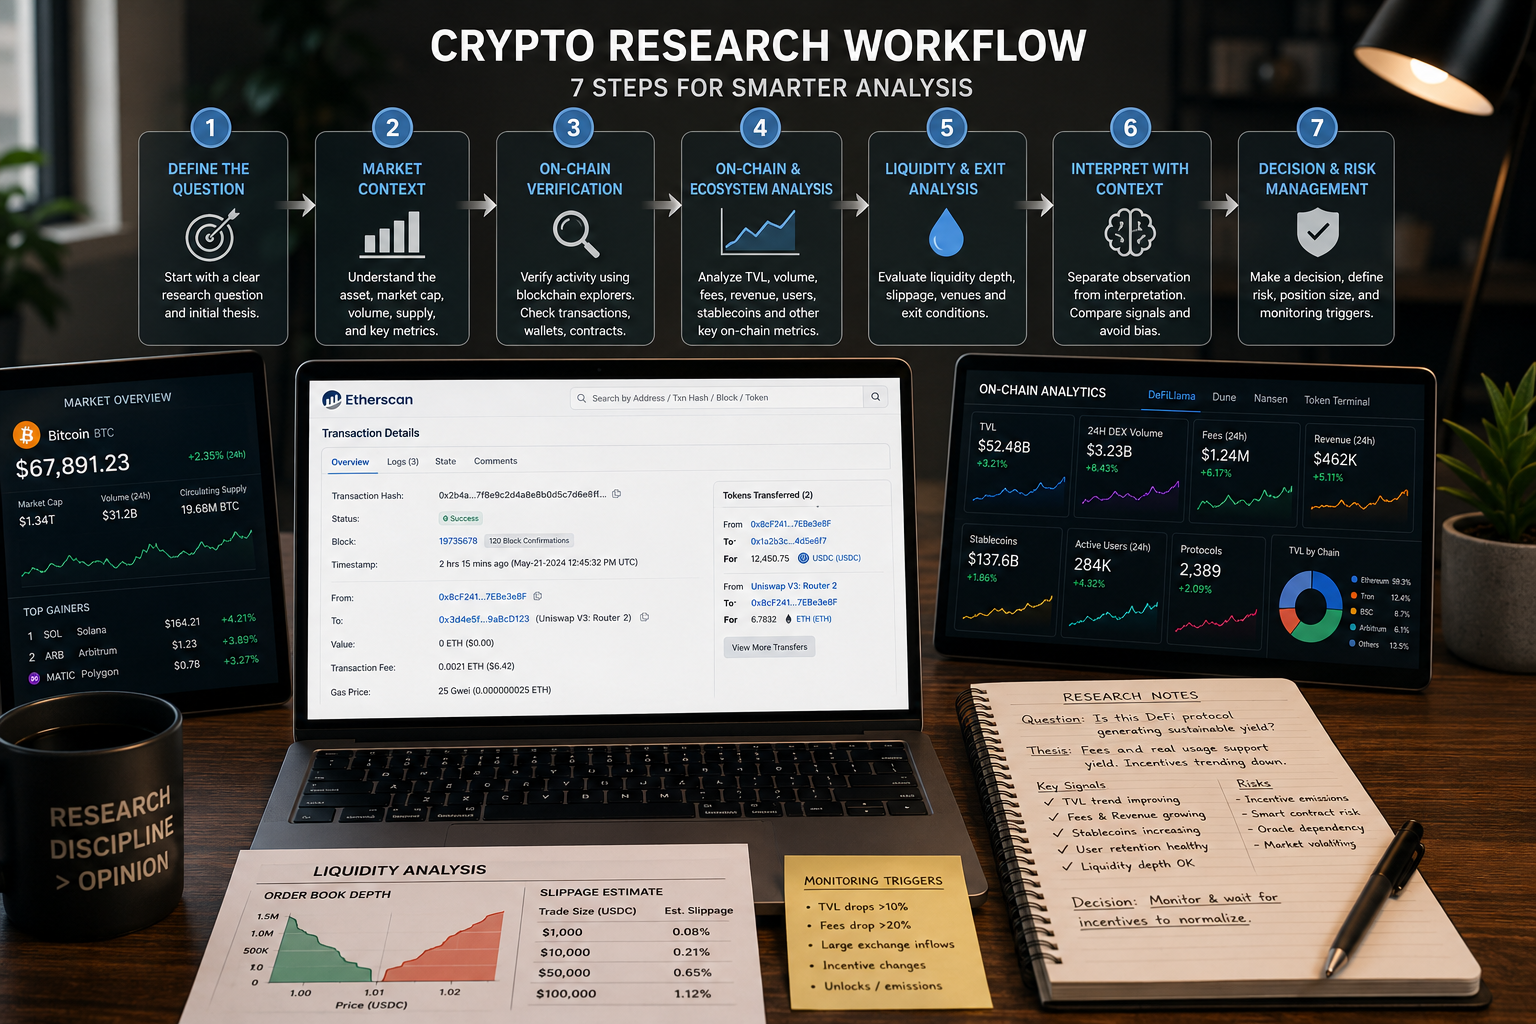
Understanding crypto on-chain trends is essential to identify real market conditions beyond price movements.
This weekly analysis focuses on structural signals across blockchain ecosystems, including liquidity flows, user behavior, and protocol activity.
Instead of reacting to short-term volatility, this report highlights how capital moves and what current on-chain data suggests about market positioning.
Key On-Chain Signals This Week
| Indicator | Observation | Market Signal |
|---|---|---|
| Exchange Flows | Declining inflows | Reduced sell pressure |
| Stablecoin Supply | Flat | Limited new liquidity |
| DeFi Activity | Stable | Neutral positioning |
| Layer-2 Usage | Gradual increase | Early recovery |
| NFT Activity | Weak | Low speculative demand |
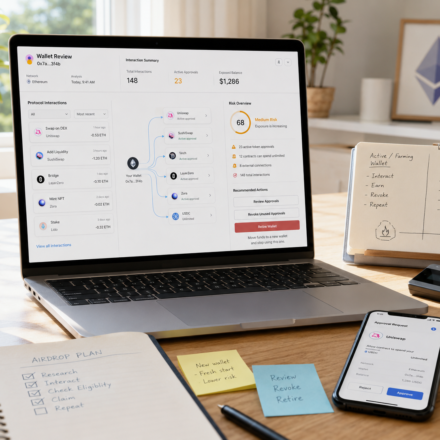
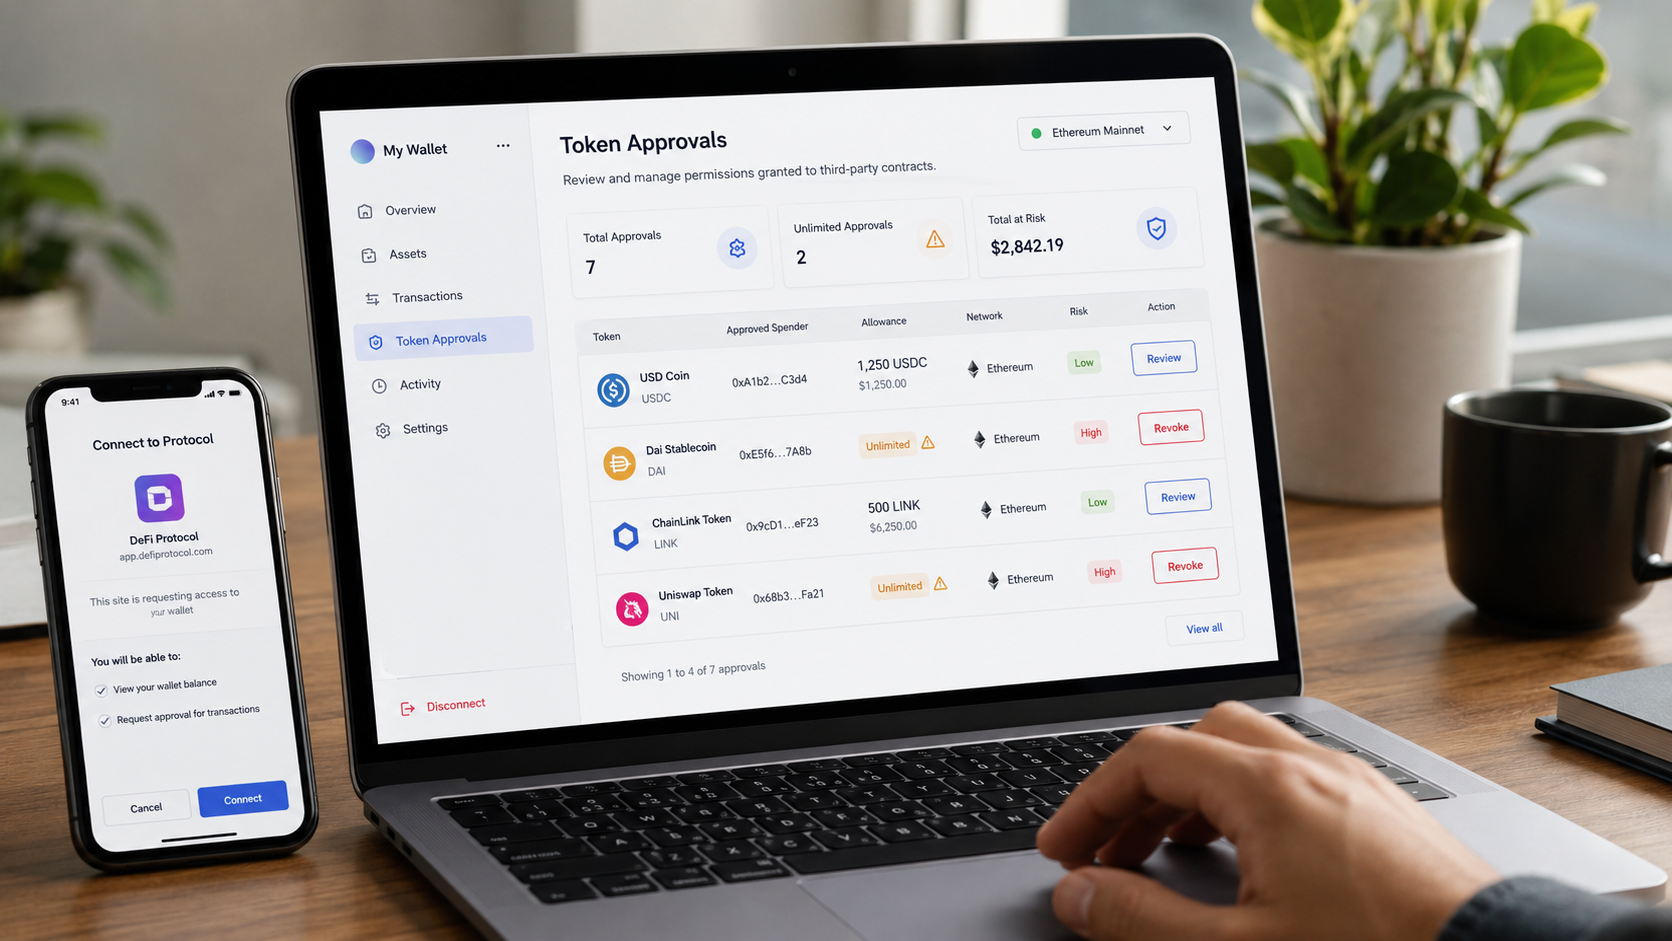
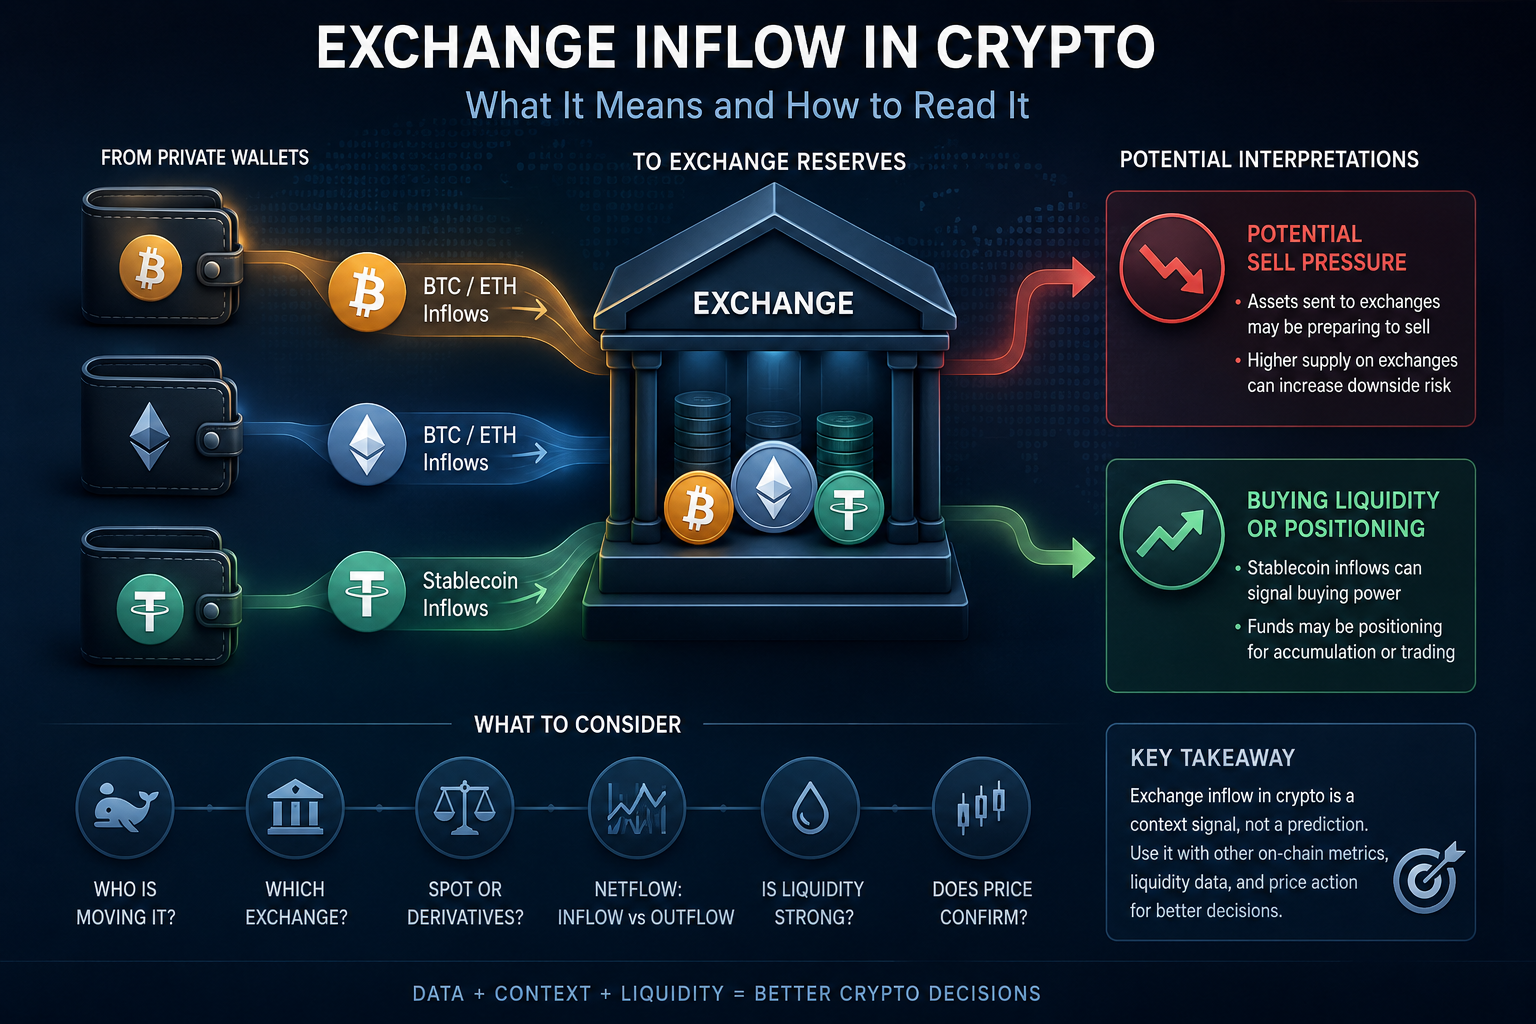
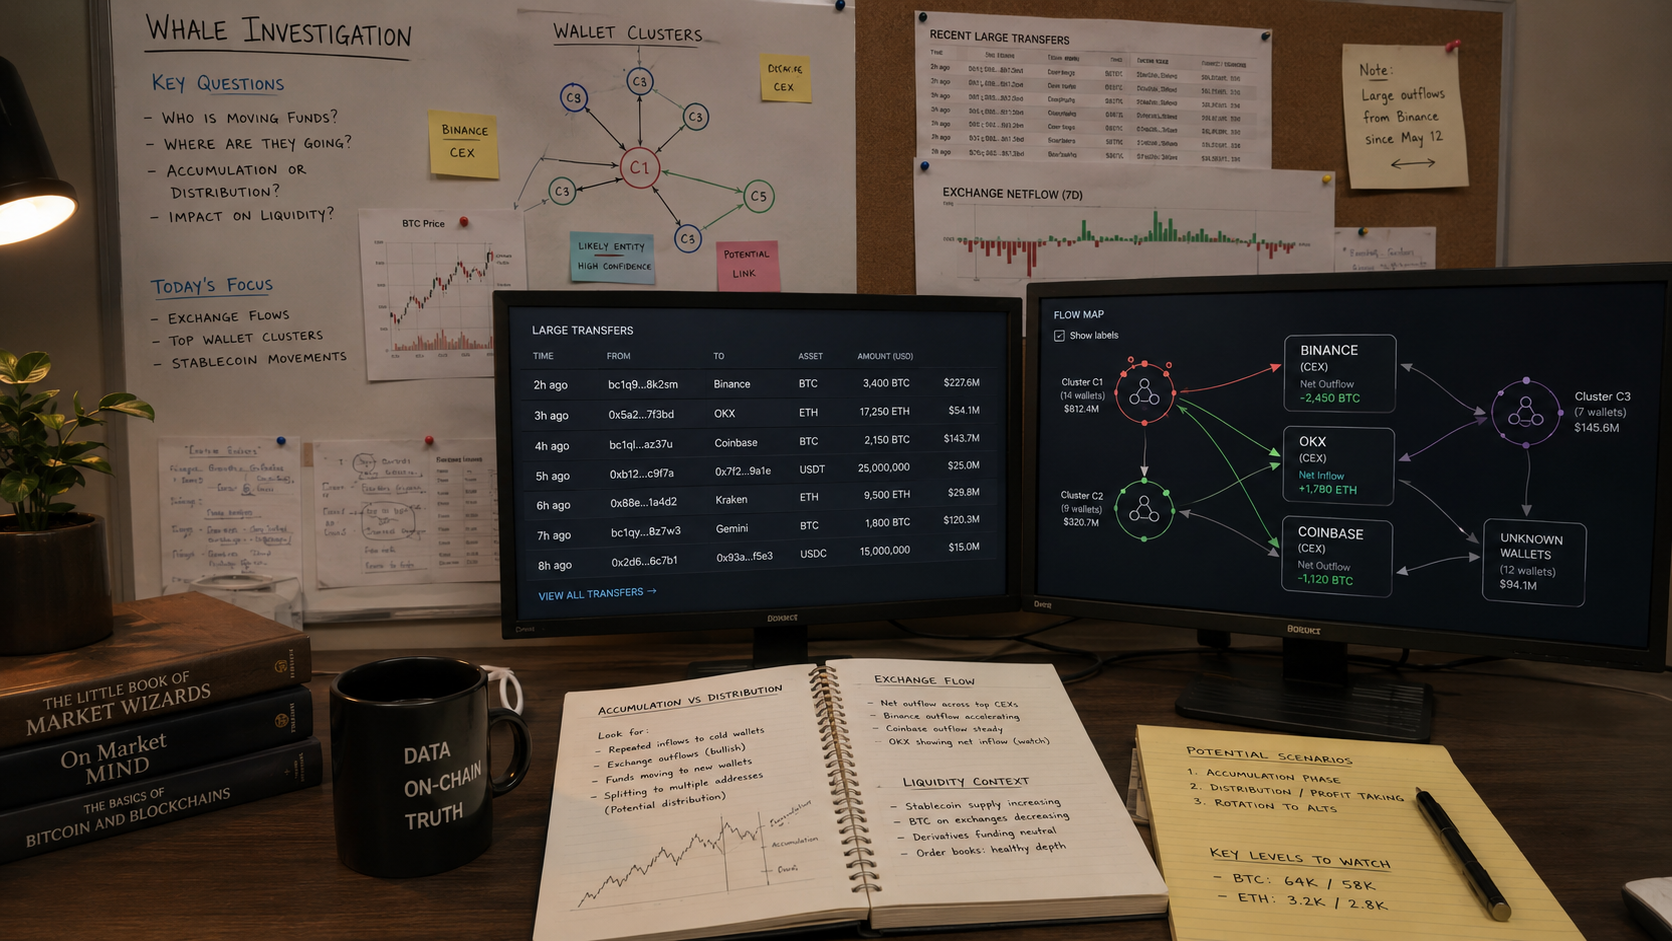
Exchange Flows Indicate Reduced Sell Pressure
A major component of crypto on-chain trends is exchange flow analysis.
This week shows:
- declining net inflows to centralized exchanges
- reduced activity from large wallets
- absence of large transfer spikes
👉 This typically indicates lower immediate selling pressure, rather than strong accumulation.
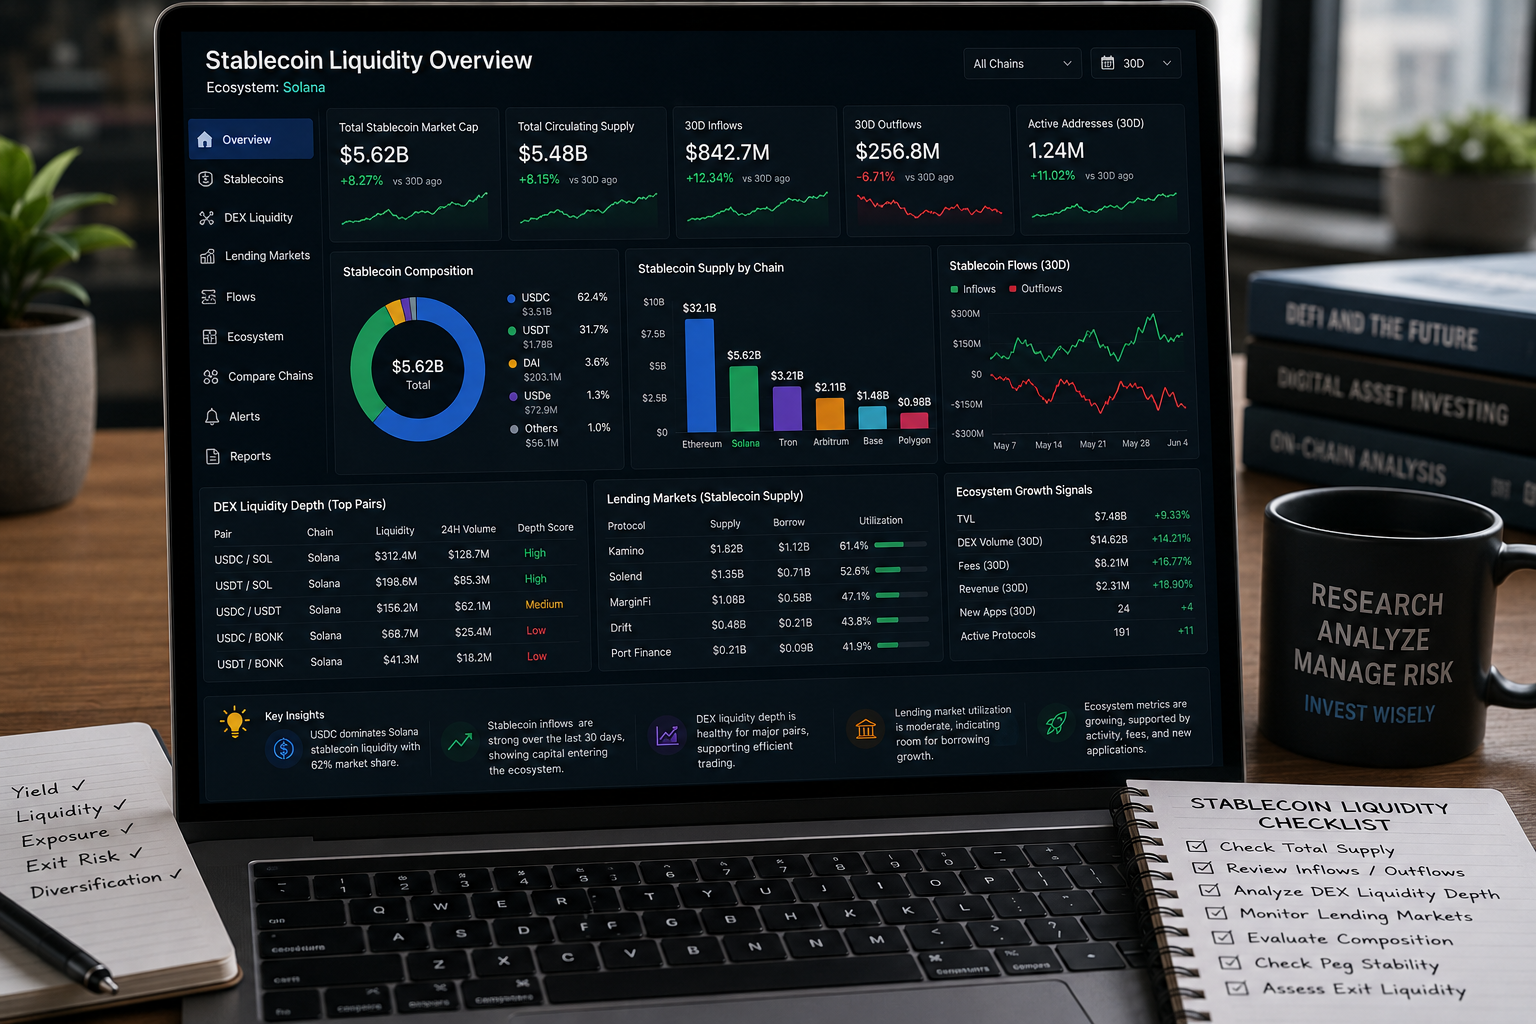
Stablecoin Liquidity Remains Flat
Stablecoins act as a proxy for market liquidity.
Current data suggests:
- stablecoin supply has plateaued
- minting activity remains limited
- no significant increase in circulating capital
👉 From a crypto market trends perspective, this reflects a lack of fresh capital inflow.
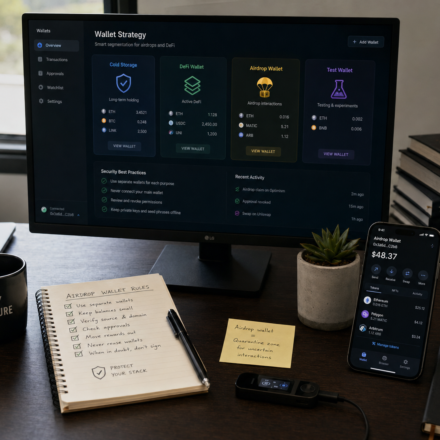
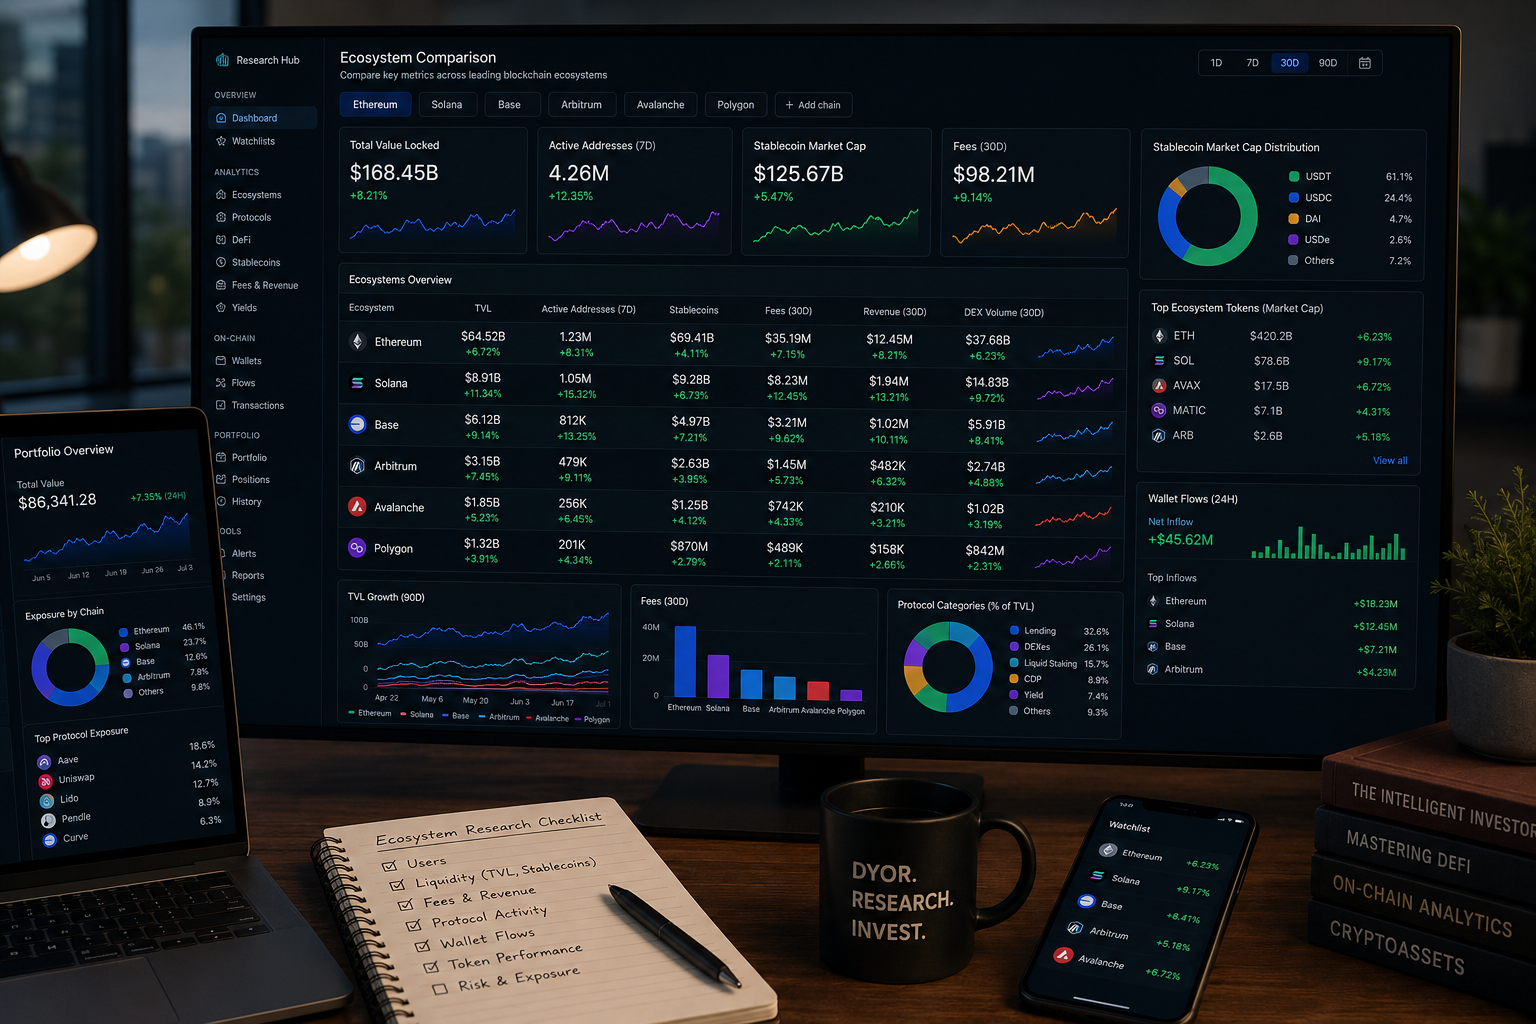
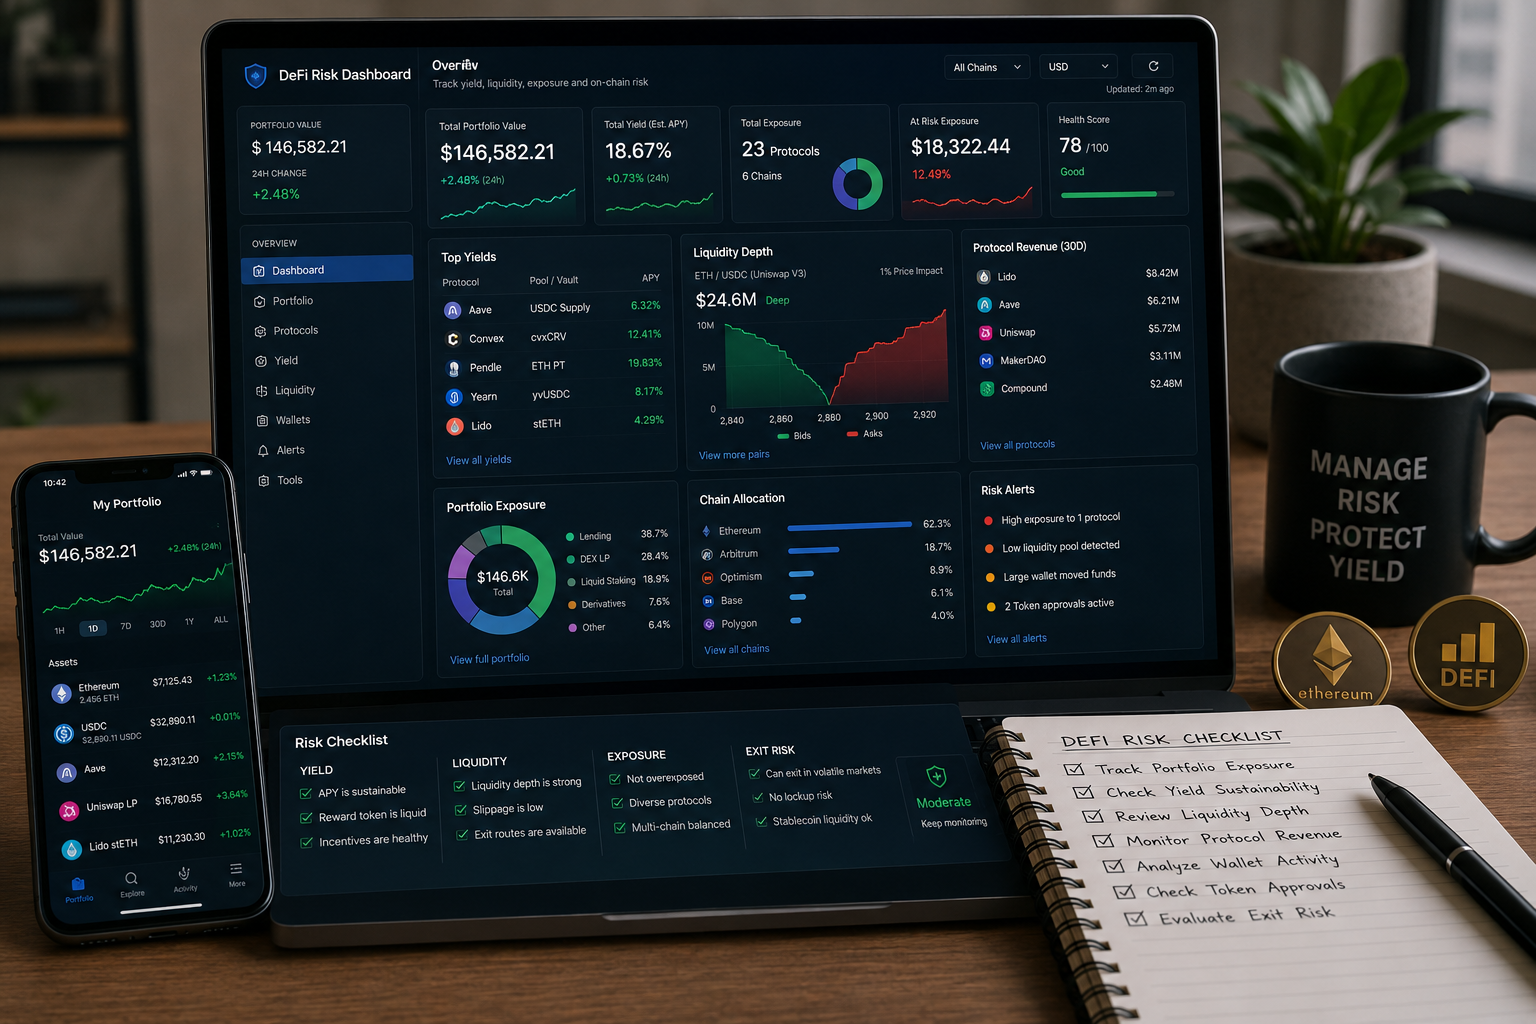
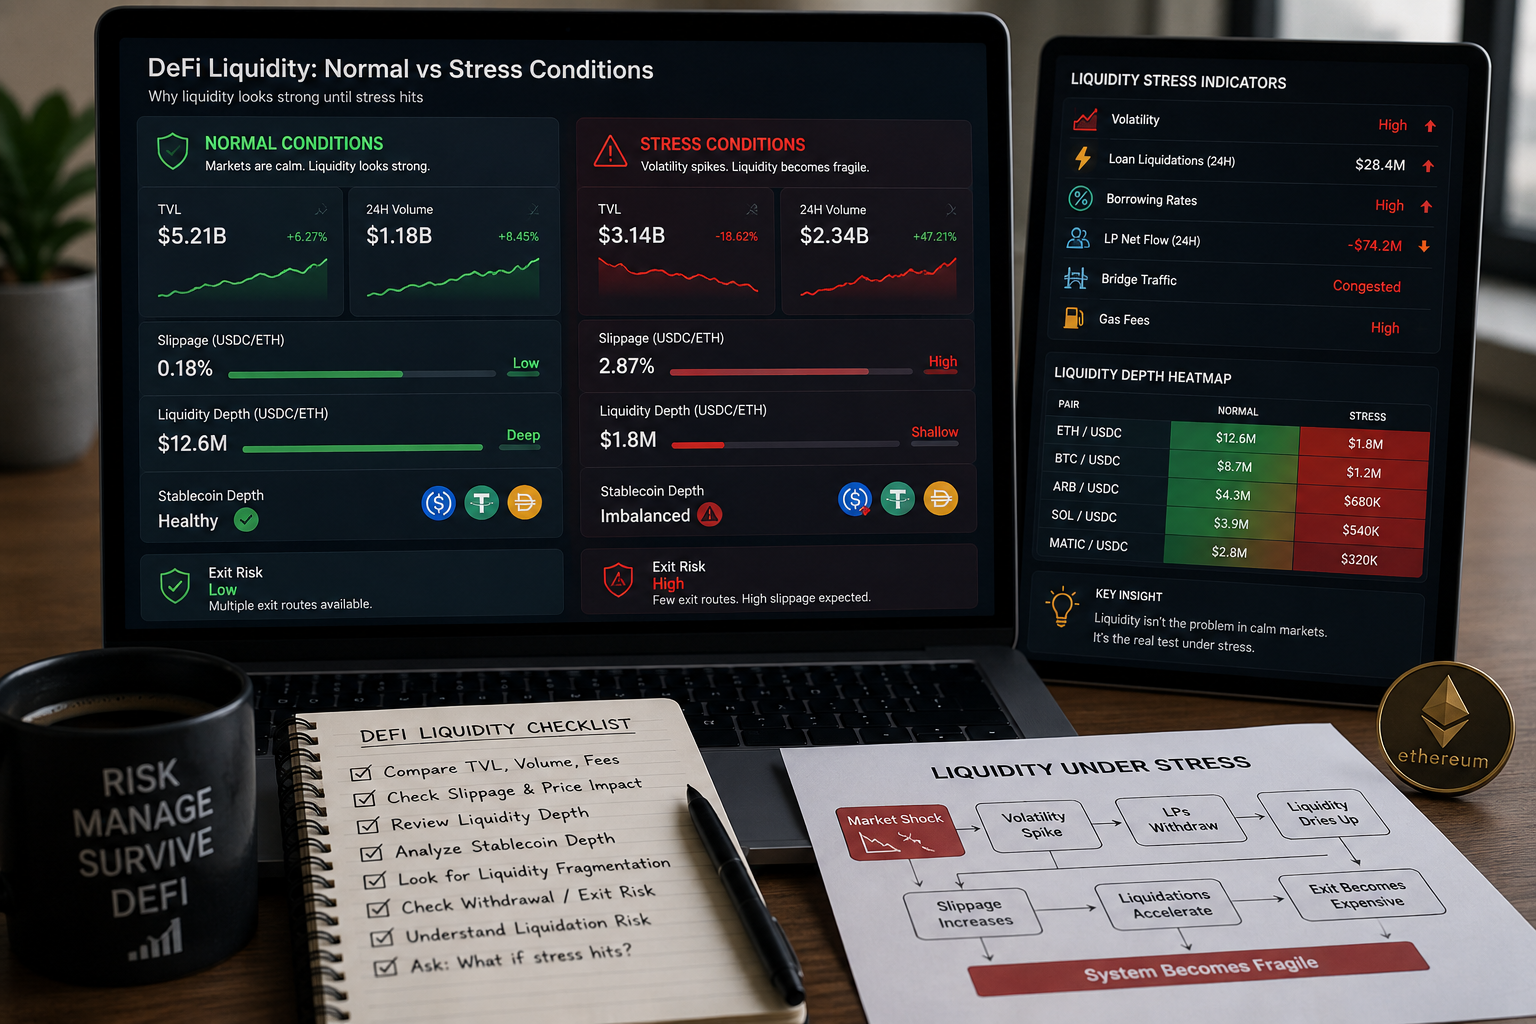
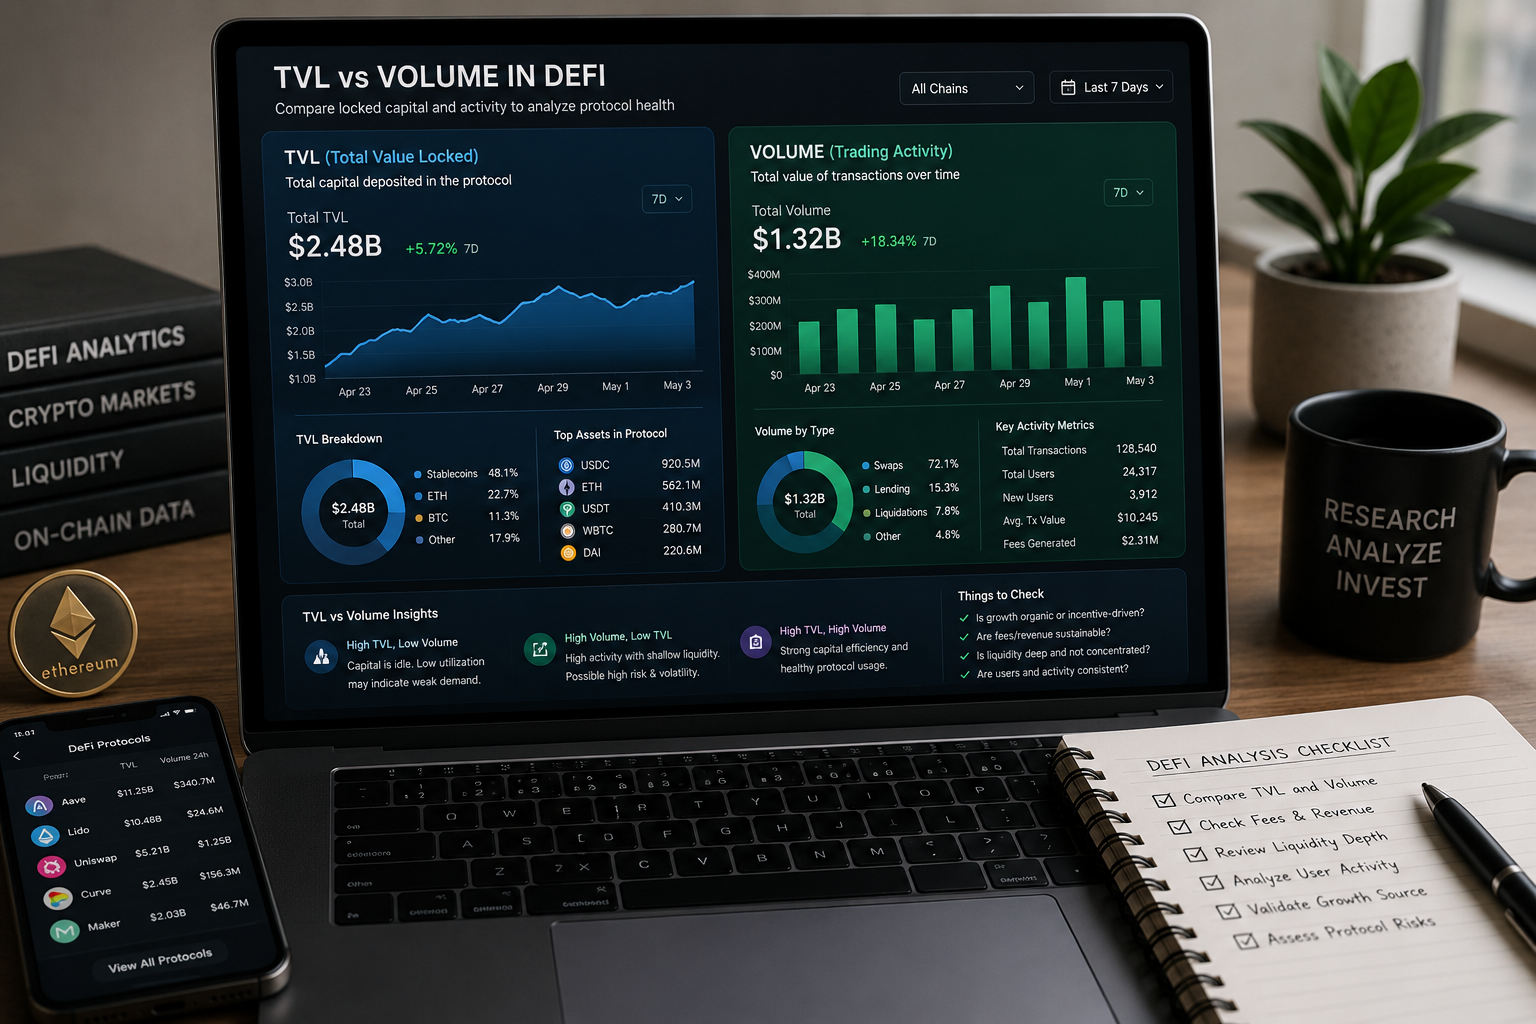
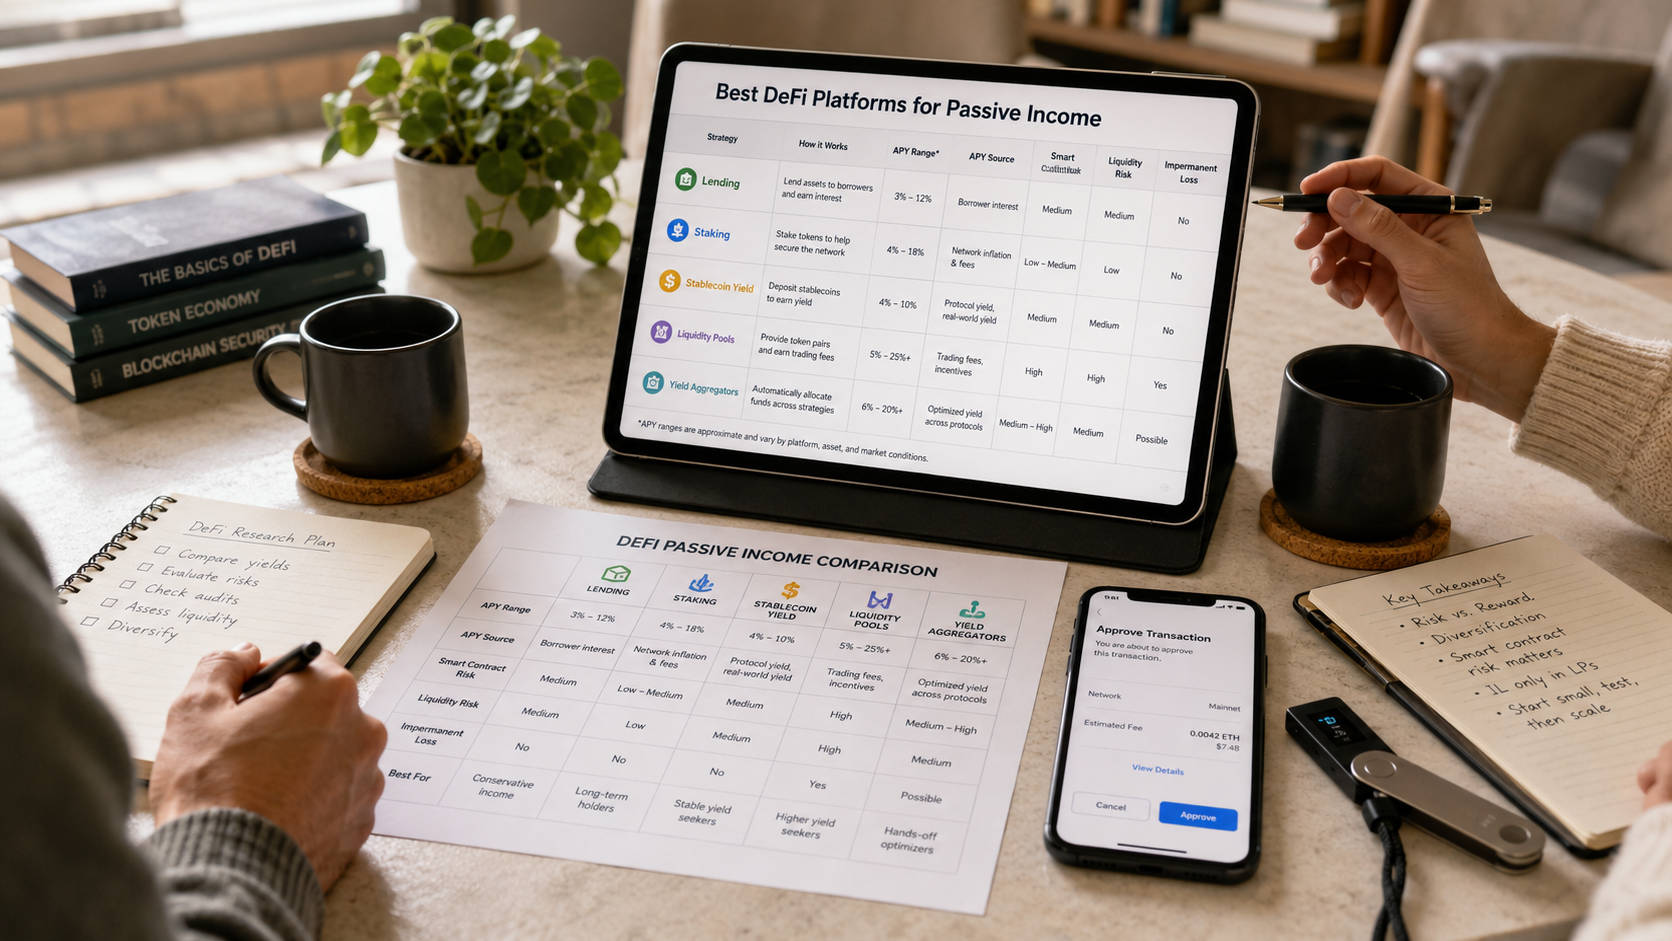
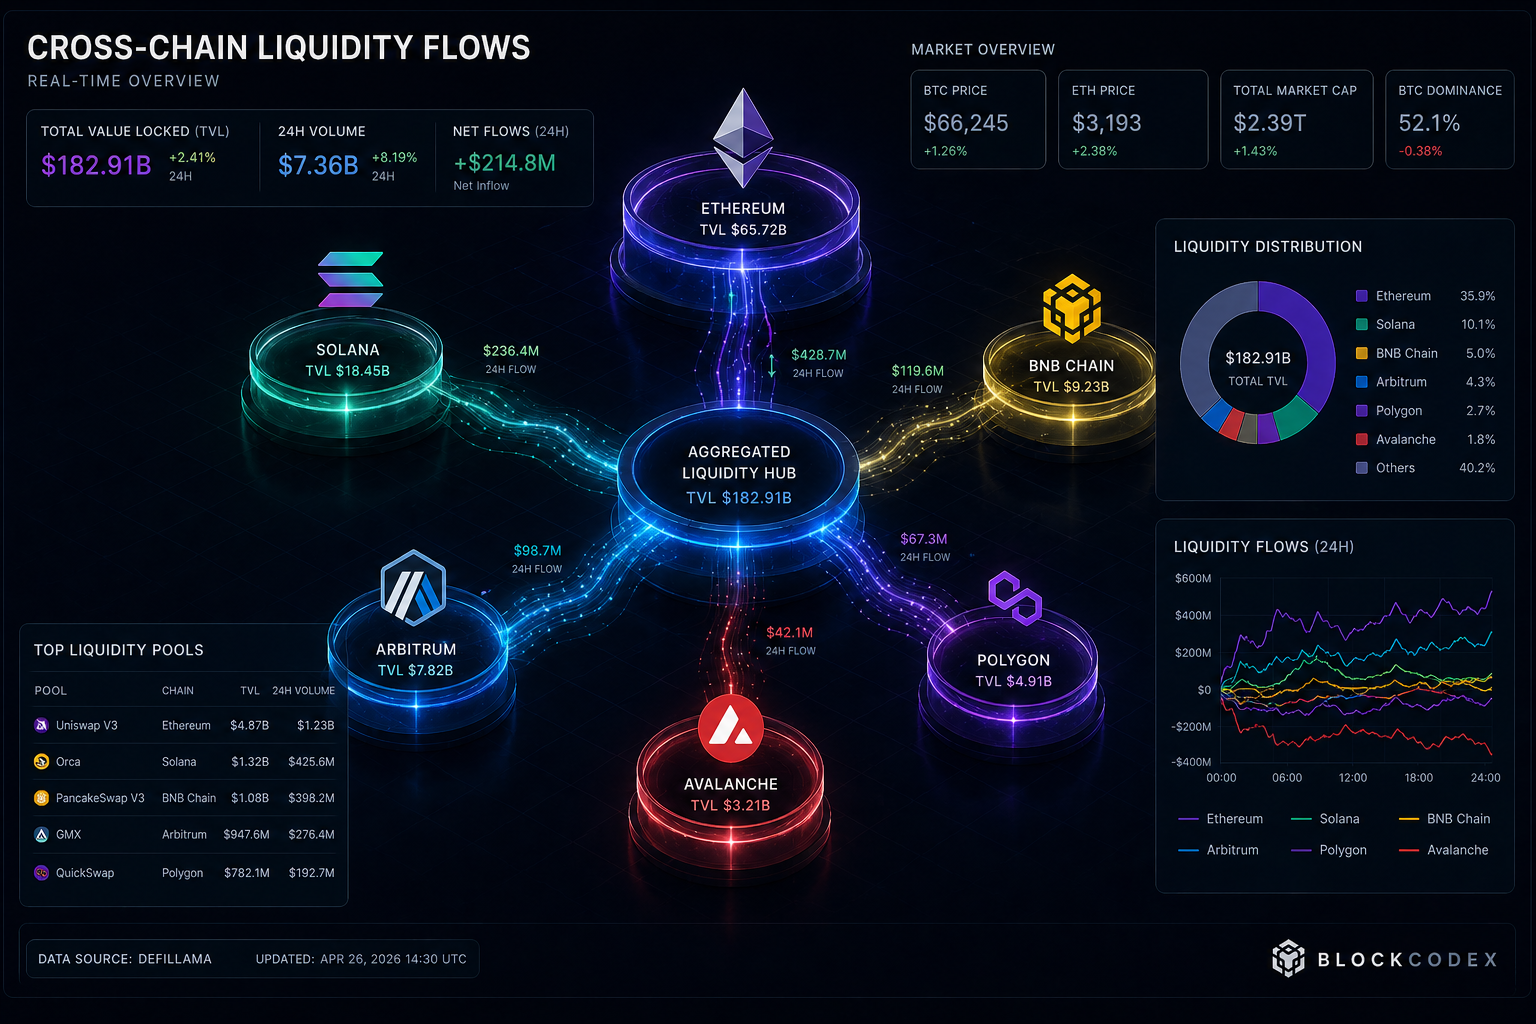
DeFi Activity Signals a Neutral Environment
DeFi metrics show short-term stabilization:
- stable total value locked (TVL)
- consistent lending activity
- reduced yield volatility
👉 This indicates a risk-neutral market phase, where investors maintain positions rather than actively reallocating.
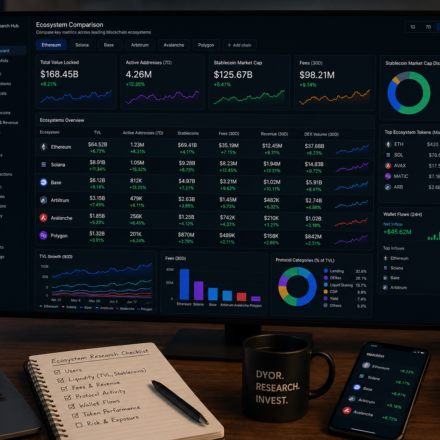
Layer-2 Usage Shows Early Recovery
Layer-2 ecosystems continue to expand gradually.
Observed signals:
- moderate increase in transaction volume
- slight growth in active addresses
- renewed dApp interaction
👉 This trend reflects underlying demand for scalable infrastructure.
NFT Markets Remain Weak
NFT activity continues below previous cycle levels:
- declining trading volume
- reduced participation
- fewer high-value transactions
👉 This suggests a shift from speculation to more selective, utility-driven usage.
What These Crypto On-Chain Trends Mean for Investors
Combining these signals reveals a broader pattern:
👉 market compression
This phase is characterized by:
- low volatility in capital flows
- stable liquidity
- limited new capital
- gradual usage recovery
👉 Historically, such conditions precede:
- expansion phases
- or extended consolidation
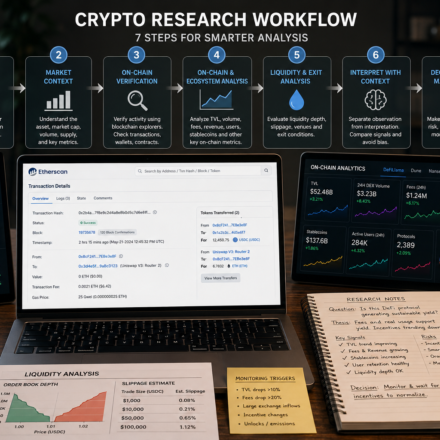
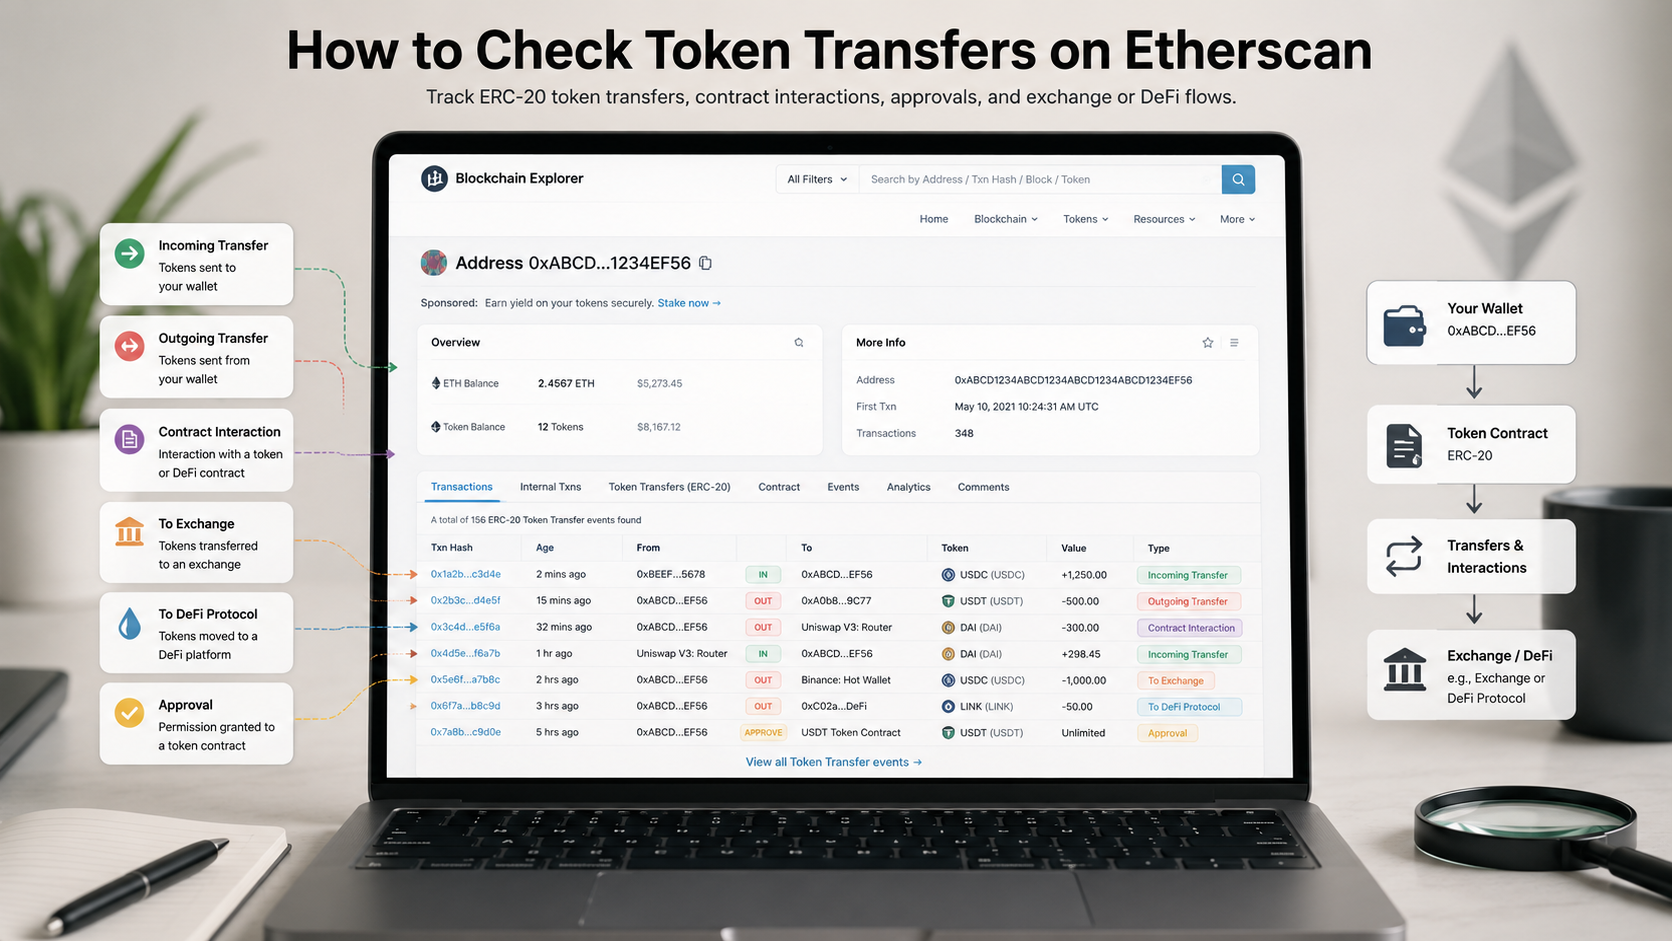
Understanding On-Chain Data More Deeply
To better interpret these crypto on-chain trends, understanding how raw blockchain data reflects real usage is essential.
👉 See our guide:
“What On-Chain Activity Really Tells Us About Network Usage”
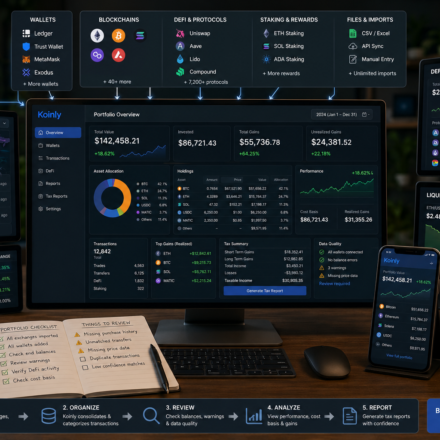
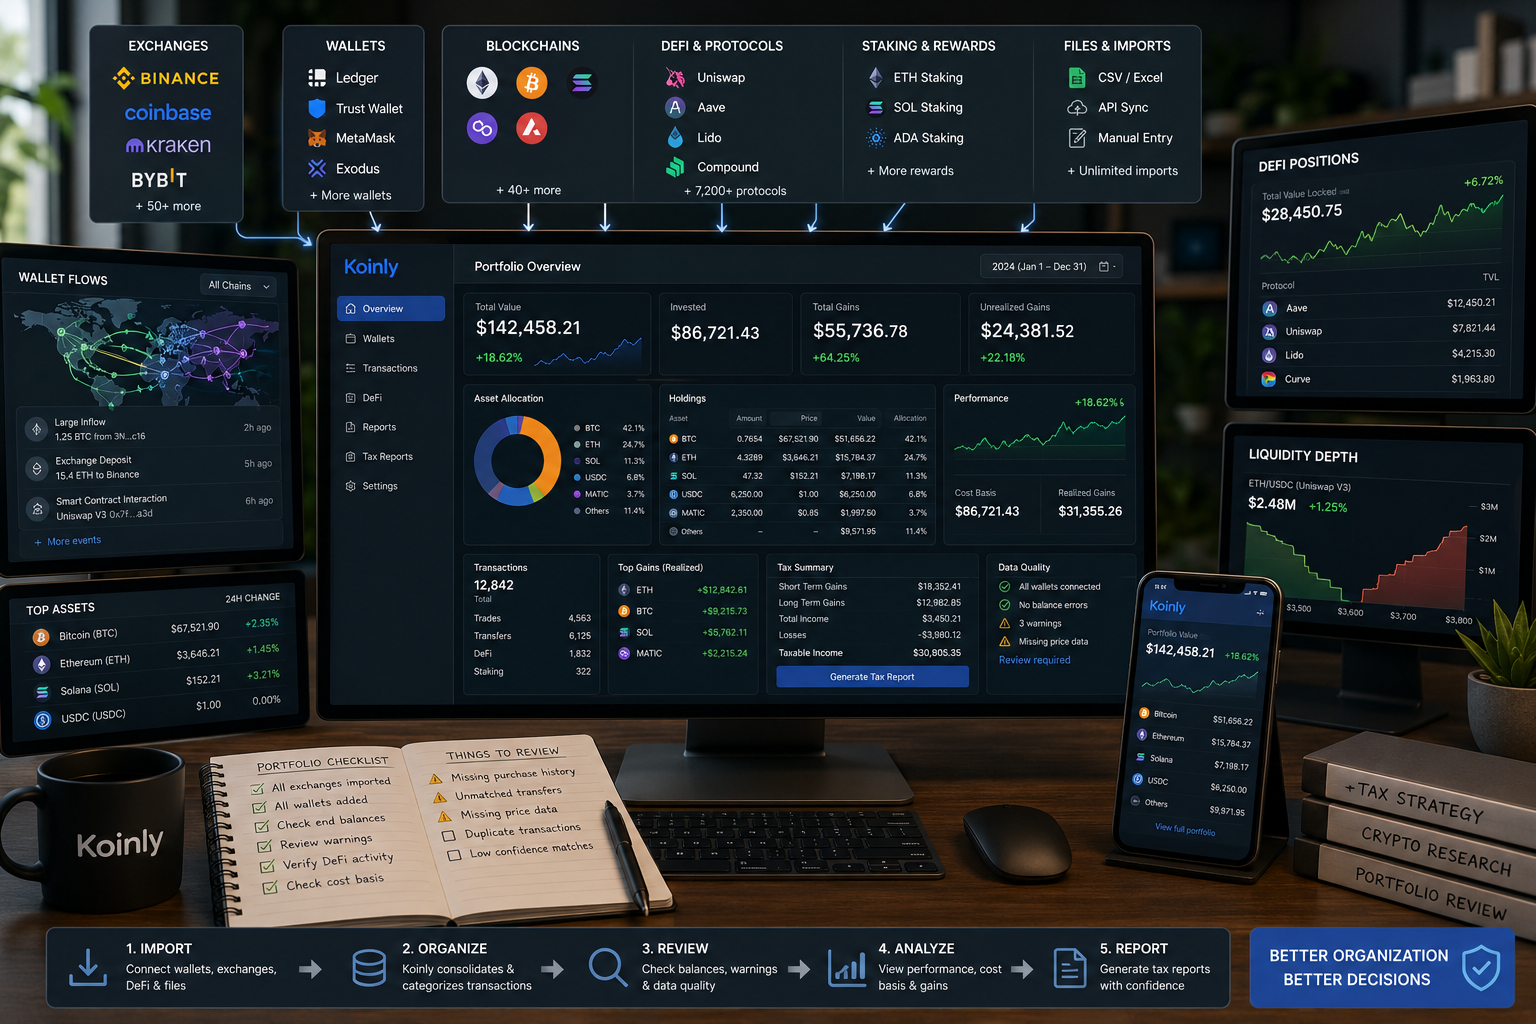
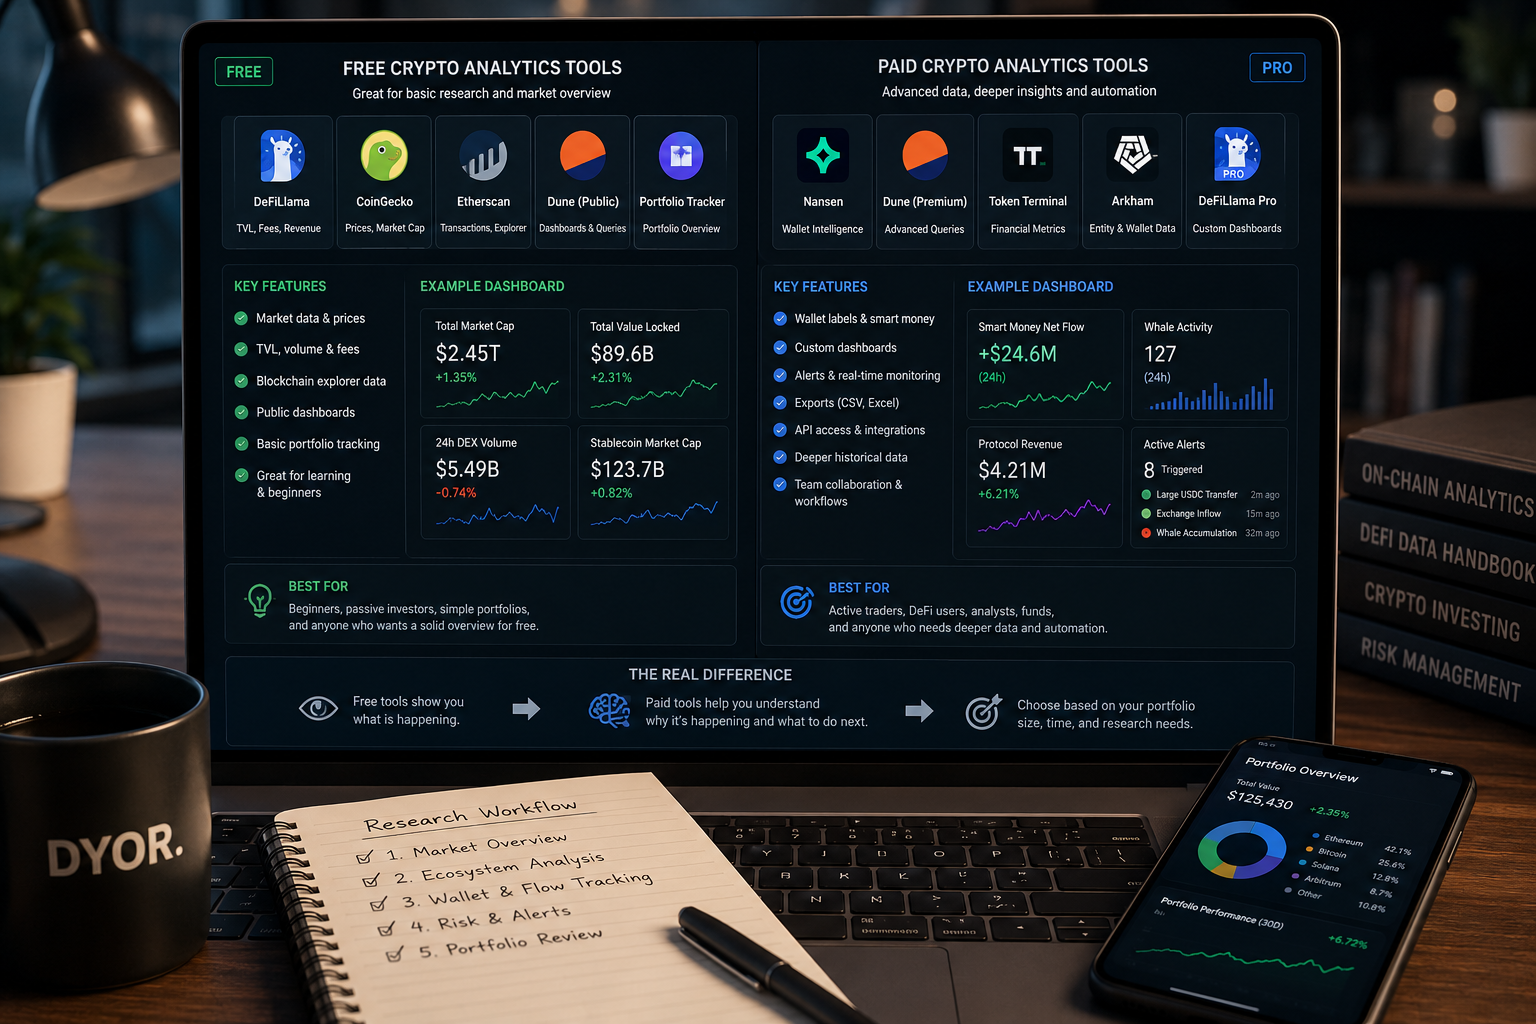
Tool Spotlight
Dune Analytics
Dune Analytics is widely used for tracking crypto on-chain trends through custom dashboards.
It allows users to:
- query blockchain data using SQL
- build real-time analytics dashboards
- monitor protocol-level metrics
👉 This makes it particularly useful for weekly trend analysis.
Conclusion
This crypto on-chain trends report highlights a market currently in a neutral and transitional phase.
Reduced exchange pressure, flat liquidity, and gradual Layer-2 recovery suggest that market participants are waiting for stronger catalysts.
Rather than signaling immediate direction, these indicators provide a structural understanding of market conditions.
: 5 Key Signals Showing a Market Pause")
: 5 Key Signals Showing a Market Pause")