On-chain data gives crypto investors something rare: direct visibility into blockchain activity.
Transactions, wallet flows, token transfers, smart contract interactions, stablecoin movement, exchange deposits, and holder behavior can all be observed publicly. In theory, this should make crypto markets easier to analyze than traditional financial markets.
In practice, many investors still misread the data.
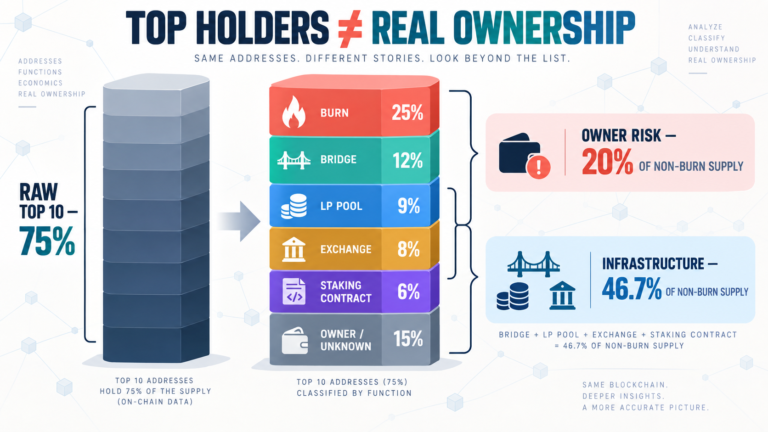
The problem is not that on-chain data is useless. The problem is that investors often treat it as more precise than it really is. A metric may be accurate at the raw data level and still be misunderstood at the interpretation level.
A spike in active addresses does not automatically mean real user growth. Rising TVL does not always mean capital conviction. Whale transfers do not always mean selling. High transaction counts do not always indicate economic value.
The core mistake is confusing visibility with understanding.
On-chain data shows what happened. It does not always explain why it happened.
That gap is where most bad analysis begins.
Table of Contents
Why On-Chain Data Feels More Reliable Than It Is
On-chain metrics feel objective because they come directly from blockchains.
A transaction either happened or it did not. A wallet balance is visible. A contract interaction is recorded. A token transfer has a timestamp, block number, sender, receiver, and value.
That makes blockchain data powerful.
But interpretation is harder.
Glassnode defines realized capitalization as a variation of market capitalization that values each coin based on the price when it last moved, rather than the current market price. This can help estimate the value stored in the network based on actual coin movement, but it still requires careful interpretation.
That example shows the broader issue: good metrics are not simple signals. They are models.
Realized cap is useful because it adjusts how capital is measured. But it does not tell investors exactly who bought, why they bought, or whether they will hold.
The same applies to most on-chain metrics.
They reduce uncertainty. They do not eliminate it.
Mistake 1: Confusing Activity with Adoption
One of the most common mistakes is assuming more activity means more adoption.
Activity can come from many sources:
- Real users
- Bots
- Arbitrage
- Airdrop farming
- NFT mints
- Bridge usage
- Spam transactions
- Internal protocol operations
- Repeated micro-transactions.
A chain may show strong transaction growth while real economic demand remains limited.
This is especially important on low-fee networks, where users and bots can generate large transaction counts cheaply. High activity may still be meaningful, but it needs to be paired with other signals.
Better questions include:
- Are users returning?
- Are transactions linked to useful applications?
- Is fee revenue growing?
- Are stablecoins being used?
- Is liquidity staying?
- Are developers building around the activity?
The point is not to dismiss activity.
The point is to separate usage volume from user value.
This connects directly with BlockCodex’s guide “What On-Chain Activity Really Tells Us About Network Usage”.
Mistake 2: Reading TVL as Trust
Total Value Locked is one of the most cited metrics in DeFi.
It is also one of the most misread.
Investors often interpret TVL as trust: if more capital is locked in a protocol, the protocol must be stronger. Sometimes that is true. But TVL can grow for reasons that have little to do with durable confidence.
TVL can rise because:
- Token prices increase
- Incentives attract mercenary liquidity
- Capital is recursively reused
- Stablecoins rotate between protocols
- Large wallets temporarily park funds
- A protocol launches a reward campaign.
TVL measures capital presence. It does not automatically measure capital quality.
A protocol with high TVL but weak volume, low fees, heavy incentives, or concentrated deposits may be less healthy than it appears.
The better interpretation is:
TVL is a starting point, not a conclusion.
For a deeper breakdown, see BlockCodex’s article “How to Read TVL in Crypto: What It Really Signals About Capital and Risk”.
Mistake 3: Treating Whale Transfers as Intent
Whale tracking is useful, but it is often overinterpreted.
A large wallet movement can mean many things:
- Selling preparation
- Custody restructuring
- OTC settlement
- Internal exchange transfer
- Market making
- Collateral movement
- Treasury management
- DeFi strategy rotation.
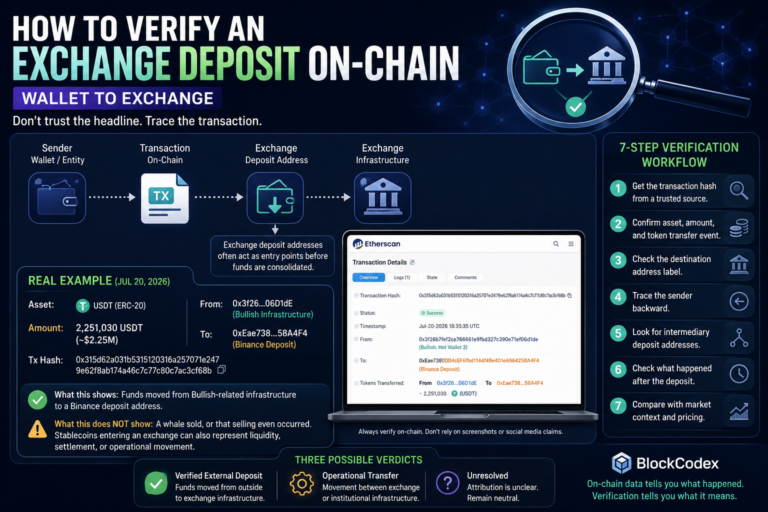
Without wallet labels, destination context, and liquidity conditions, a whale transfer is only partial information.
A whale moving coins to an exchange may increase potential sell pressure. But it may also reflect collateral usage, liquidity provision, or an internal transfer. A whale withdrawing from an exchange may indicate accumulation, but it may also be custody migration.
Glassnode’s whale analysis separates large-balance cohorts and uses balance changes to distinguish possible accumulation and distribution behavior, which is more useful than reacting to isolated transfers.
The better approach is to analyze patterns:
- Is the wallet repeatedly depositing to exchanges?
- Is the movement linked to a token unlock?
- Are other large wallets moving too?
- Is liquidity deep enough to absorb selling?
- Is the wallet known, labeled, or connected to an exchange?
A single whale alert is noise.
A repeated behavioral pattern can become signal.
For more detail, see BlockCodex’s guide “How to Analyze Whale Activity: 7 On-Chain Signals Investors Should Track.”
Mistake 4: Ignoring Liquidity Context
On-chain data becomes much more powerful when combined with liquidity.
A large transfer means different things depending on market depth.
If liquidity is deep, a large movement may have limited price impact. If liquidity is thin, even moderate selling can cause sharp slippage.
This is why investors should compare on-chain flows with:
- Order book depth
- DEX pool liquidity
- Bid-ask spreads
- Stablecoin liquidity
- Slippage
- Exchange quality
- Spot vs derivatives volume.
CoinGecko’s 2025 Annual Crypto Industry Report showed that stablecoin market cap increased by $102.1 billion, or 48.9%, in 2025, reaching $311.0 billion. That matters because stablecoins act as a major liquidity layer across crypto markets, but their presence does not automatically mean liquidity is evenly distributed across assets or chains.
This is the key insight:
On-chain flows show movement. Liquidity determines impact.
A whale deposit, token unlock, or stablecoin inflow only becomes meaningful when investors understand whether the market can absorb it.
For this reason, on-chain analysis should never be separated from market structure.
Mistake 5: Assuming Stablecoin Growth Always Means Risk-On Demand
Stablecoin growth is one of the most important signals in crypto.
But it can be misread too.
Stablecoins can indicate:
- Capital waiting to buy
- Liquidity parked defensively
- Payment demand
- DeFi collateral usage
- Exchange settlement
- Cross-border transfer activity
- Market maker inventory
- Treasury management.
A growing stablecoin supply does not automatically mean investors are about to buy risk assets.
The a16z State of Crypto 2025 report says adjusted stablecoin transaction volume reached nearly $1.25 trillion in September 2025, and that adjusted volume reached $9 trillion over the previous 12 months, up 87% year over year.
That shows stablecoins are becoming a major settlement layer, not just dry powder for speculation.
For investors, this changes the interpretation.
Stablecoin activity can support bullish liquidity conditions, but it can also reflect non-speculative usage such as payments, settlement, and treasury operations. The signal becomes stronger only when stablecoin growth aligns with exchange flows, spot demand, DeFi activity, and capital retention.
Stablecoins are not one signal. They are a liquidity system.
Mistake 6: Ignoring Bot, Scam, and Artificial Activity
Another reason investors misread on-chain data is that not all activity is organic.
Some activity is generated by:
- Bots
- Wash trading
- Fake volume
- Sybil wallets
- Airdrop farming
- Phishing interactions
- Contract spam
- Malicious token transfers.
Chainalysis describes crypto drainers as phishing tools built for Web3, where attackers impersonate projects, convince users to connect wallets, and push transaction approvals that allow funds to be stolen.
This matters because on-chain data records both healthy and unhealthy activity.
A spike in wallet interactions may not mean adoption. It could reflect a phishing campaign, bot activity, or exploit-related movement. A token transfer count may rise because scam tokens are being distributed. An NFT contract may show activity because attackers are targeting wallets.
Investors need to ask:
- Is activity coming from unique users or repeated wallets?
- Are wallets newly created?
- Is activity clustered around incentives?
- Are transactions economically meaningful?
- Are malicious contracts involved?
- Does activity continue after rewards end?
Raw activity without quality filters can create false confidence.
Mistake 7: Looking for One Perfect Metric
The biggest mistake is trying to find one metric that explains the market.
There is no single perfect on-chain signal.
MVRV, realized cap, TVL, active addresses, exchange flows, stablecoin supply, transaction count, and holder behavior all reveal different parts of the system.
The mistake is using one metric in isolation.
A better framework is layered:
| Question | Useful Metrics |
|---|---|
| Is capital entering? | Realized cap, stablecoin flows |
| Are users active? | Active addresses, transactions, retention |
| Is liquidity strong? | TVL quality, DEX liquidity, stablecoins |
| Are holders in profit? | MVRV, realized profit/loss |
| Are whales moving supply? | Exchange flows, whale balances |
| Is demand organic? | Fees, revenue, repeat usage |
| Is risk rising? | Leverage, unlocks, slippage, approvals |
The strongest analysis comes from convergence.
If multiple independent signals point in the same direction, confidence increases. If signals conflict, investors should slow down.
On-chain data is most useful when treated as a system, not a scoreboard.
How to Read On-Chain Data More Accurately
A better on-chain workflow should follow three steps.
1. Start with the metric definition
Before using any metric, understand what it actually measures.
Does it count wallets or users?
Does it include internal transfers?
Does it adjust for bots?
Does it measure value, activity, or behavior?
If the definition is unclear, the conclusion will be weak.
2. Add context
No metric should be interpreted alone.
Always compare with:
- Price
- Liquidity
- Volume
- Incentives
- Market cycle phase
- Protocol events
- Macro conditions
- Unlock schedules.
Context turns raw data into interpretation.
3. Look for behavioral confirmation
Strong analysis asks whether behavior confirms the signal.
If TVL rises, are users active too?
If whale outflows increase, is liquidity tightening?
If stablecoins grow, is spot demand rising?
If active addresses spike, do users return later?
Behavioral confirmation is what separates real adoption from temporary noise.
Use Nansen as a Context Layer
Most investors misread on-chain data because raw explorers and dashboards show activity without enough wallet context.
This is where an analytics platform like Nansen can fit naturally.
Nansen helps investors interpret wallet behavior using labels, token flows, smart money tracking, and entity-level analysis. It does not turn on-chain data into certainty, but it can reduce blind spots by showing whether activity is coming from exchanges, whales, funds, protocols, or newly created wallets.
A practical use case:
- Use explorers to verify raw transactions
- Use DeFiLlama or Token Terminal to check protocol metrics
- Use Nansen to understand wallet behavior and flow context
- Compare all of it with liquidity and market structure.
For investors trying to avoid surface-level interpretation, Nansen can be useful as a research layer rather than a signal machine.
For a broader workflow, see BlockCodex’s guide “7 Best Crypto Analytics Tools That Reveal Powerful On-Chain Truths”.
Conclusion
Most investors misread on-chain data because they expect it to provide simple answers.
But blockchains provide evidence, not certainty.
Activity does not always mean adoption. TVL does not always mean trust. Whale transfers do not always reveal intent. Stablecoin growth does not always mean immediate risk-on demand. Volume does not always equal liquidity. And one metric never explains the entire market.
The real value of on-chain analysis comes from interpretation.
Investors need definitions, context, behavioral confirmation, and a willingness to question obvious narratives.
Used poorly, on-chain data becomes another source of false confidence.
Used well, it becomes one of the strongest tools for understanding how crypto markets actually behave.
The edge is not seeing the data.
The edge is knowing what the data can — and cannot — prove.