


At some point, every investor runs into the same confusion.
A project looks strong. The chart is going up, sentiment is positive, the community is active — everything suggests momentum.
And yet, weeks later, the price starts fading without any obvious reason.
This is usually where tokenomics start to matter.
Because price alone rarely tells the full story. What sits behind it — supply structure, unlock schedules, distribution — often explains moves that seem irrational at first glance.
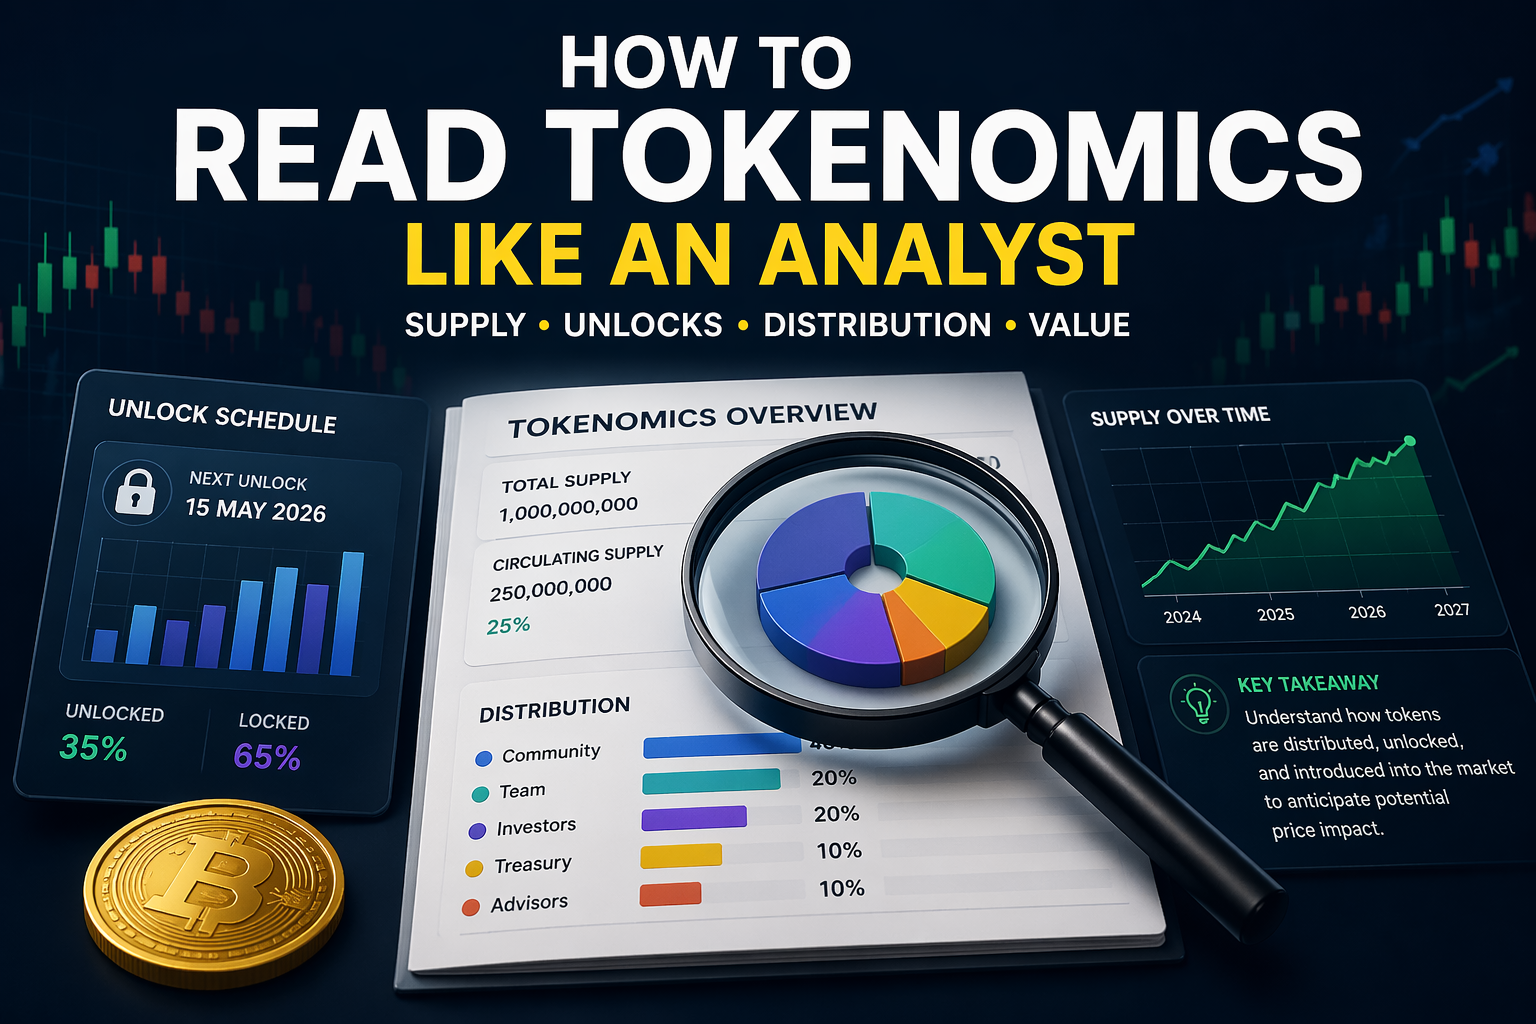
Learning how to read tokenomics like an analyst is not about memorizing metrics. It’s about understanding how tokens actually enter the market, who holds them, and what incentives drive their behavior over time.
This is exactly why learning to read tokenomics like an analyst becomes essential as market conditions evolve.
Tokenomics are not numbers — they are a timeline
One of the most common mistakes is to treat tokenomics as a static snapshot.
Circulating supply, total supply, market cap — these numbers are useful, but they only describe the present moment. They don’t explain what’s coming next.
In reality, tokenomics behave more like a timeline.
Tokens are created, allocated, locked, and gradually released. Each phase introduces a potential shift in market dynamics. The moment a token becomes liquid, it creates a decision for the holder: hold, rotate, or sell.
That decision, repeated across thousands of participants, becomes market pressure.
So instead of asking “what is the supply today?”, a better question is:
👉 what will the supply look like over the next 3 to 6 months?
That shift alone is a big step toward understanding how to read tokenomics like an analyst.
The illusion of low market cap
A project showing a relatively small market cap often attracts attention. It feels early, it feels like upside is still ahead.
But this impression can be misleading.
Imagine a token with a $50M market cap, but only a small fraction of its total supply is circulating. At first glance, it looks undervalued. In reality, that valuation is based on a limited float.
As more tokens unlock, the effective supply increases, and the market needs to absorb that additional liquidity. If demand doesn’t grow at the same pace, price pressure appears. Looking beyond surface-level metrics is one of the first steps to read tokenomics like an analyst.
This is why analysts rarely look at market cap alone. They compare it with the fully diluted valuation and, more importantly, with the unlock schedule.
The gap between what exists today and what will exist tomorrow is where most of the risk sits.
Fully diluted valuation: useful, but incomplete
Fully diluted valuation (FDV) is often used to estimate the “true” size of a project. It assumes that all tokens are already in circulation.
This can be helpful as a reference point, but it has limits.
FDV does not tell you when tokens will enter the market. Two projects can have similar FDV ratios and behave completely differently depending on their unlock pace.
A slow, predictable emission may be absorbed smoothly. A large unlock concentrated over a short period can create significant volatility.
That’s why analysts don’t stop at FDV. They look at distribution over time, not just totals.
Interpreting FDV in context is another key element when you read tokenomics like an analyst.
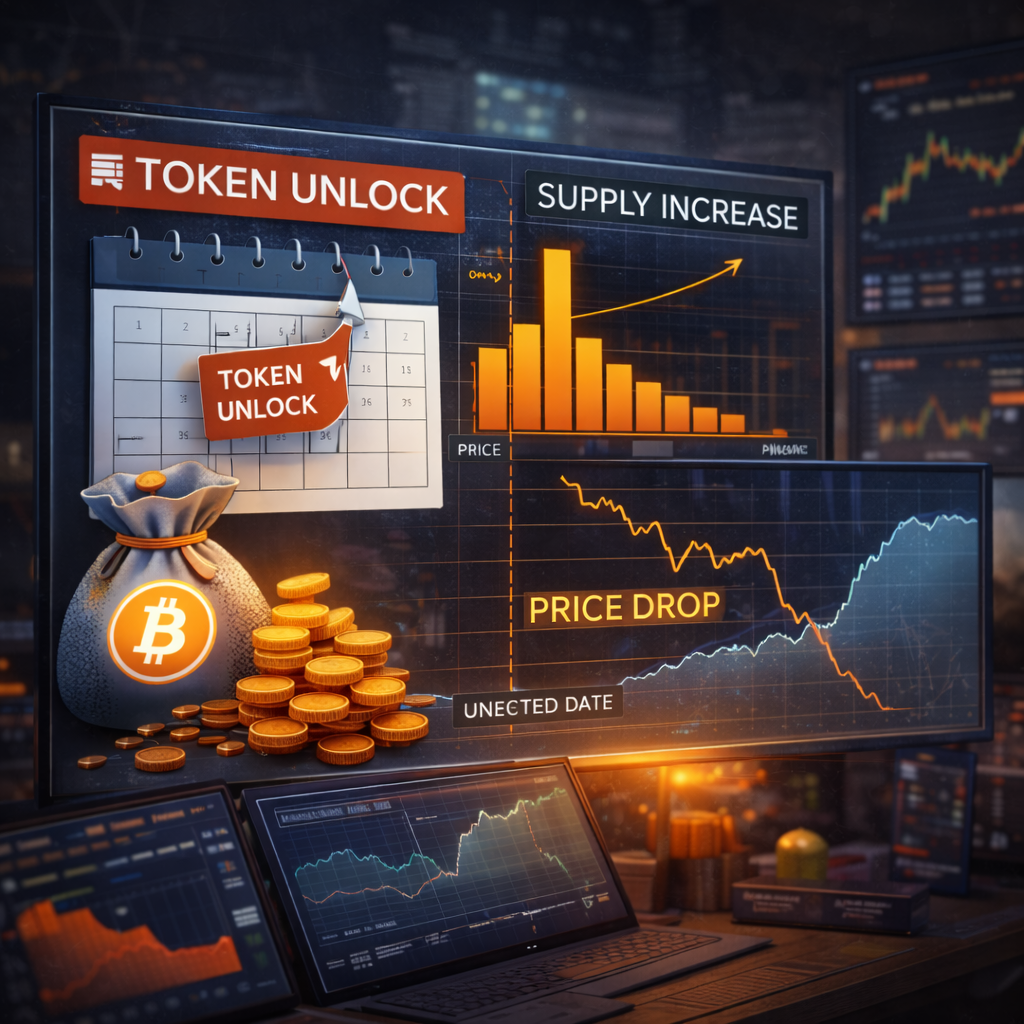
Unlocks are where theory becomes price action
If there is one concept that consistently explains unexpected price movements, it’s unlocks.This is where you start to truly read tokenomics like an analyst rather than react to price.
At some point, locked tokens become transferable. When that happens, early participants — team members, private investors, contributors — gain the ability to act.
Even if only a fraction of them decide to sell, the impact can be noticeable.
What makes this dynamic interesting is that markets tend to anticipate it.
When a large unlock is approaching, some participants reduce exposure in advance. Others wait for volatility. The result is often a gradual shift before the event itself.
By the time the unlock happens, part of the move is already priced in.
Understanding this anticipation mechanism is central to how to read tokenomics like an analyst. It’s not about reacting to events — it’s about positioning ahead of them.
A concrete example: token unlock pressure in real conditions
One of the clearest ways to understand tokenomics is to look at how markets react to actual unlock events.
A widely documented case comes from the $APE token (ApeCoin), where scheduled unlocks created recurring supply pressure throughout 2023.
According to publicly available data tracked by platforms like Token Unlocks and research coverage from Messari, ApeCoin experienced monthly unlocks representing millions of tokens entering circulation.
For example:
- in March 2023, over 40 million APE tokens were unlocked
- this represented a significant increase relative to circulating supply at the time
- a large portion of these tokens was allocated to contributors and early stakeholders
What followed was not a single sharp drop — but a pattern.
Price tended to weaken around unlock periods, with increased volatility and downward pressure over time.
This didn’t happen in isolation. It reflected a structural dynamic:
new supply entering the market → holders gaining liquidity → partial selling → pressure on price.
What this example actually shows
The key takeaway is not that unlocks always lead to price declines.
It’s that supply events create conditions that the market must absorb.
In the case of ApeCoin:
- unlocks were predictable
- the size of emissions was significant
- distribution was concentrated among early participants
This combination created a recurring imbalance between supply and demand.
Even when sentiment improved temporarily, the underlying structure continued to influence price behavior.
Connecting data to analyst thinking
This is where the analyst mindset becomes critical.
Instead of reacting to price movements after they happen, analysts look at:
- how much supply is entering
- who is receiving it
- and whether the market can realistically absorb it
Platforms like Token Unlocks, Messari, or CoinGecko make this data accessible — but interpretation is what creates an edge.
Understanding how to read tokenomics like an analyst means connecting these data points to real market behavior.
Distribution reveals incentives
Another layer that often gets overlooked is who holds the tokens.
Not all holders behave the same way.
An early investor who entered at a very low valuation may have different incentives than a long-term participant who joined later. A contributor receiving tokens over time may act differently from a fund managing portfolio rotations.
Token distribution tells a story about potential behavior.
If a large portion of supply is concentrated among a few actors, market moves can be amplified. If distribution is broader, price action may be more stable.
This doesn’t mean one structure is “good” or “bad” by default. It means that each structure creates a different risk profile.
Understanding incentives at this level is critical if you want to read tokenomics like an analyst.
A quick reality check
Industry research has repeatedly highlighted how supply structure influences market behavior.
Reports from firms such as Chainalysis and Messari have shown that token distribution and unlock schedules often play a significant role in volatility, especially in early-stage projects.
Periods of large emissions or concentrated unlocks have frequently been associated with increased selling pressure — even when the underlying project continues to develop.
This doesn’t mean that price always declines after unlocks.
It means that supply dynamics are an essential part of the equation, alongside demand and narrative.
Reading tokenomics in real conditions
In practice, analyzing tokenomics is less about complex calculations and more about asking the right questions.
When looking at a project, it helps to mentally map its structure.
How much supply is already circulating?
How much remains locked?
How fast will new tokens enter the market?
Who is likely to receive them?
These questions don’t require perfect data. They require clarity.
Over time, patterns start to emerge. Some projects show smooth emission curves. Others concentrate risk in specific periods. Some distribute broadly, others remain highly concentrated.
Recognizing these patterns is what gradually builds intuition.
The analyst mindset
What separates an analyst from a casual observer is not access to better data.
It’s perspective.
Instead of focusing on current price action, analysts try to anticipate future conditions. They look at what the market will need to absorb, not just what it has already absorbed.
They consider timing, incentives, and structure.
That forward-looking approach is what defines how to read tokenomics like an analyst.
When tokenomics contradict the narrative
There are moments when market sentiment and token structure move in opposite directions.
A project may gain visibility, attract attention, and trend across platforms — while at the same time approaching a phase of increasing supply.
In these situations, price can remain strong temporarily, supported by momentum. But underlying pressure may still be building.
This doesn’t automatically lead to a reversal. But it creates a fragile equilibrium.
Understanding that tension between narrative and structure is one of the most valuable insights tokenomics can offer.
Connecting tokenomics to decision-making
Tokenomics alone do not determine whether a project is worth investing in.
They provide context.
A strong product with weak token structure can still perform, but may face headwinds. A well-designed token model without adoption may struggle for different reasons.
That’s why tokenomics should be read as part of a broader framework.
If you want to explore that broader perspective, you can look at how to evaluate a crypto project from multiple angles here: 👉 https://blockcodex.io/evaluate-a-crypto-project-before-investing/
Conclusion
Understanding how to read tokenomics like an analyst is less about mastering formulas and more about developing a way of thinking.
It’s about looking beyond the present moment and asking what comes next.
Supply is not static.
Distribution is not neutral.
Timing is not random.
And once you start seeing these elements clearly, price movements begin to make a lot more sense.
FAQ
What does it mean to read tokenomics like an analyst?
It means going beyond basic metrics and understanding how supply evolves over time — including unlocks, distribution, and potential market impact.
Why are token unlocks important?
Token unlocks introduce new supply into the market. To read tokenomics like an analyst, you need to anticipate when this supply may affect price dynamics.
What is the difference between market cap and fully diluted valuation?
Market cap reflects current circulating tokens, while fully diluted valuation includes the total supply. The gap between them often indicates future dilution risk.
Do tokenomics really impact price?
Yes, over time. Supply changes, distribution, and holder behavior can influence price, especially when new tokens enter circulation.