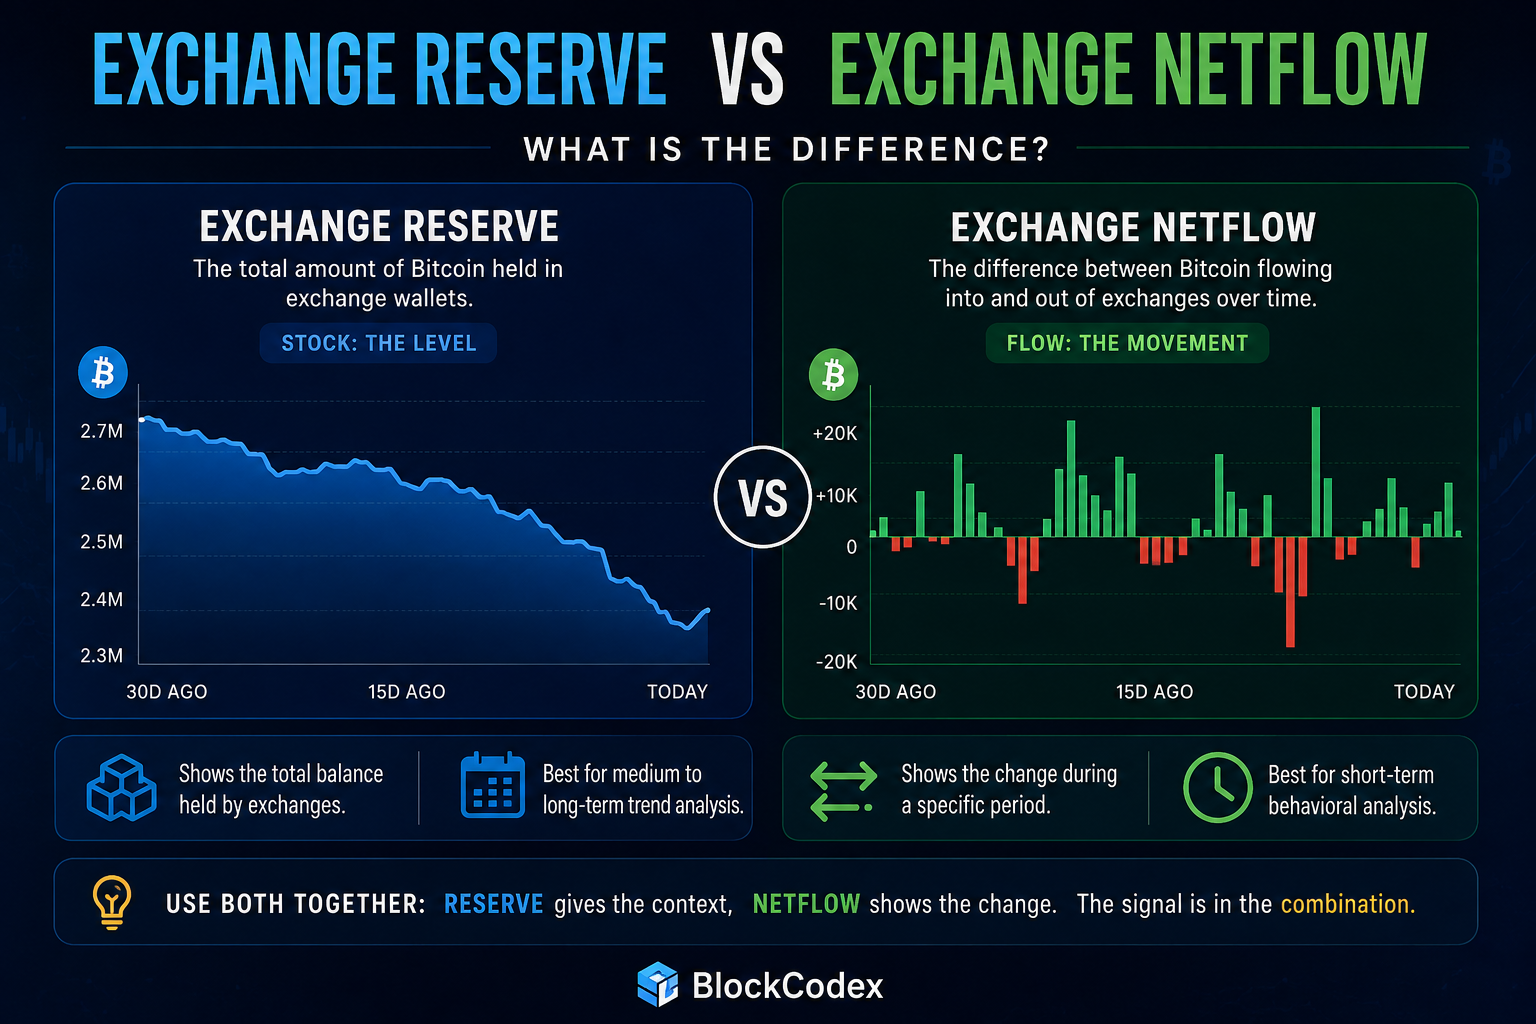
Understanding exchange reserve vs exchange netflow starts with a simple distinction: reserve tells you how much Bitcoin is currently sitting on exchanges, while netflow tells you how that balance changed during a specific period.
The two metrics are closely connected, which is exactly why they are often confused. Repeated positive netflows can push exchange reserves higher, while persistent withdrawals can gradually reduce them. Yet looking at only one of the two can produce a very different interpretation of the same market.
Exchange reserve measures the accumulated state of exchange-held supply. Exchange netflow measures the movement changing that state.
For investors, the useful question is not which metric is better. It is whether recent flows are strong enough to alter the larger exchange-supply trend.
Exchange Reserve vs Exchange Netflow: The Core Difference
The cleanest way to separate the metrics is to think in terms of stock and flow.
Exchange Reserve measures the amount of an asset held in addresses classified as belonging to exchanges. Exchange Netflow measures inflows minus outflows over a selected period.
| Question | Exchange Reserve | Exchange Netflow |
|---|---|---|
| What does it measure? | Total exchange-held supply | Inflow minus outflow |
| Type of metric | Stock | Flow |
| Main perspective | Accumulated state | Recent change |
| Best for | Structural supply trends | Detecting behavioral shifts |
| Typical timeframe | Medium to long term | Short to medium term |
| Main weakness | Can react slowly to change | One spike can be overinterpreted |
| Best confirmation | Netflow + market context | Reserve trend + price/liquidity |
A reservoir provides a useful analogy. Exchange reserve is the amount of water currently inside it, while exchange netflow tells you whether more water entered than left during the period being measured.
The level and the movement are related, but they answer different questions.
What CryptoQuant Exchange Reserve Actually Shows
CryptoQuant exchange reserve tells investors how much Bitcoin is held across the exchange wallets included in the selected dataset.
For analysis, the trend is generally more useful than staring at one absolute figure. A sustained decline means exchange-held inventory is contracting over time, while a sustained increase means more BTC is accumulating inside exchange infrastructure.
That does not tell you what every holder intends to do.
A Bitcoin withdrawal may represent long-term custody, but it can also have other purposes. Likewise, BTC deposited on an exchange becomes more readily available for trading, yet a deposit does not prove that a sale occurred.
Exchange reserve is therefore best understood as a measure of supply positioning.
If reserves have been declining for months, the amount of BTC held within the measured exchange infrastructure has been shrinking. Whether that ultimately matters for price still depends on demand, liquidity and the wider market environment.
What Bitcoin Exchange Netflow Actually Shows
Bitcoin exchange netflow focuses on movement.
The calculation is straightforward:
Exchange Inflow − Exchange Outflow = Exchange Netflow
A positive result means more BTC entered the measured exchanges than left during that period. A negative result means withdrawals exceeded deposits.
Suppose 8,000 BTC enters exchanges during one day while 5,000 BTC leaves. Netflow is +3,000 BTC. The exchange-held balance has received a net addition during that period.
Now consider another day where 20,000 BTC enters and 19,500 BTC leaves. Netflow is only +500 BTC despite enormous two-way movement.
This distinction matters because netflow compresses activity into one directional number. When the result looks unusual, investors should sometimes inspect inflows and outflows separately to understand how the number was created.
For the broader meaning of deposits themselves, BlockCodex’s guide to exchange inflow in crypto explains why an inflow represents potential exchange supply rather than confirmed selling.
Why Netflow Alone Can Make a Small Event Look Important
Imagine Bitcoin exchange reserves have been declining for six months.
Then one large positive netflow appears.
Viewed alone, that bar can look like a dramatic behavioral shift. But if the amount of BTC on exchanges remains within the same broader downward trend, the new flow may only represent a temporary interruption.
The appropriate conclusion is not that the reserve trend has reversed. It is that recent behavior has moved against the established trend and deserves monitoring.
If positive netflows continue for days or weeks and the reserve curve begins flattening or turning upward, the evidence changes. A repeated flow has started altering the accumulated state.
One event creates an alert.
Persistence creates a potential regime change.
Why Exchange Reserve Alone Can Hide an Early Reversal
Reserve has the opposite weakness.
Because it reflects accumulated supply, several recent flow changes may not immediately alter its longer-term direction.
Suppose exchange reserves have been rising for months, but netflow turns negative repeatedly over the next week. The reserve may remain elevated even though current activity is removing BTC from exchanges.
In that situation, netflow is revealing a change at the margin before the slower reserve trend confirms it.
This is why reserve and netflow should not be treated as competing signals. Netflow is better at identifying recent changes, while reserve helps determine whether those changes have become structurally meaningful.
Four Exchange Reserve vs Exchange Netflow Setups
Combining the two metrics produces four useful situations.
Falling Reserve With Negative Netflow
Recent withdrawals reinforce an existing decline in exchange-held supply. The structural and short-term directions agree.
This can strengthen a declining-exchange-supply thesis, although it still says nothing certain about future demand.
Falling Reserve With Positive Netflow
The broader reserve trend remains downward, but recent activity has shifted toward deposits.
This is often more interesting than the headline positive netflow itself. The key question becomes whether deposits persist long enough to flatten or reverse the reserve trend.
Rising Reserve With Positive Netflow
Exchange-held inventory is already increasing, and recent flows continue adding to it.
For spot exchanges, that means more BTC is positioned within an environment where it can potentially be traded or sold. The signal becomes more relevant if price also begins struggling to absorb the additional supply.
Rising Reserve With Negative Netflow
The accumulated exchange balance remains high, but current movement is beginning to reduce it.
Several sessions of negative netflow may therefore appear before the reserve trend visibly changes direction.
A 30-Day Exchange Reserve vs Netflow Check
A useful way to prevent misleading comparisons is to examine both metrics over exactly the same period.
For a BlockCodex 30-day check, use:
| Setting | Value |
|---|---|
| Asset | Bitcoin |
| Data source | CryptoQuant |
| Exchange filter | Spot Exchanges |
| Metric 1 | Exchange Reserve |
| Metric 2 | Exchange Netflow |
| Window | Same 30-day period |
| Frequency | Daily |
Start with reserve and identify the direction across the full 30 days. Do not begin with the largest netflow bar.
Then inspect netflow and mark the sessions where deposits or withdrawals became unusually one-sided relative to the rest of the month.
The important observation is whether those episodes actually changed the reserve trajectory.
For example, a large positive netflow inside an otherwise declining reserve trend should initially be treated as a deviation. If similar positive readings continue and the reserve begins flattening, the interpretation becomes stronger because recent flow behavior is now changing the accumulated supply structure.
Conversely, if a positive spike disappears and the reserve continues lower, the event mattered much less structurally than the isolated bar initially suggested.
This comparison is the practical advantage of using both metrics: netflow identifies the event, while reserve tells you whether the event survived.
Price Reaction Is the Next Layer
Even when reserve and netflow agree, the analysis is not finished.
Suppose spot exchange reserves are rising and positive netflows continue. That tells you more BTC is accumulating inside exchange infrastructure, but it does not tell you whether buyers are struggling with that additional supply.
Price reaction provides another layer.
If exchange supply rises while Bitcoin remains firm and liquidity continues absorbing offers, demand may be strong enough to offset the added inventory. If supply rises while price weakens and market depth deteriorates, the potential selling-pressure interpretation becomes more convincing.
The same principle applies when exchange supply declines. Withdrawals can reduce immediately available inventory, but they cannot generate a rally if demand is weak.
This is why on-chain metrics need market context. Blockchain data describes behavior and positioning; the market determines how economically important those changes become.
Spot and Derivatives Reserves Should Not Be Read the Same Way
The destination of the assets matters.
Bitcoin held on spot exchanges is positioned differently from Bitcoin held on derivatives venues. On spot exchanges, rising reserves increase the amount of BTC available within the spot trading environment.
On derivatives platforms, deposited BTC can serve as collateral for leveraged positions. That collateral may support longs, shorts, hedges or basis trades.
A rise in derivatives exchange reserves is therefore more naturally interpreted as an increase in available collateral and potential leverage rather than as a direct bearish signal.
The same applies to netflow.
A large positive spot netflow and a large positive derivatives netflow may look similar on a chart, but the economic mechanisms behind them can be very different.
Always confirm the exchange type before drawing a directional conclusion.
Internal Exchange Transfers Can Create Noise
There is another complication: exchanges move assets between wallets they control.
Cold-storage consolidation, hot-wallet management and operational rebalancing can create large blockchain transfers without representing a new decision by an external investor.
This matters particularly when an apparent flow event looks unusually large but does not produce the expected change in reserve or market behavior.
When the data seems inconsistent, investigate before creating a narrative. What looks like fresh capital entering or leaving an exchange may instead be an internal transfer between addresses controlled by the same entity.
This is one reason exchange analytics should be treated as classified blockchain data rather than perfect knowledge of investor intentions.
A Divergence Between Reserve and Netflow Is Often Useful
Investors sometimes assume that conflicting metrics mean one of them is wrong.
With exchange reserve vs exchange netflow, divergence can be exactly what you want to identify.
A declining reserve paired with positive recent netflow tells you that the historical withdrawal trend remains intact while current behavior is starting to push against it. A rising reserve paired with repeated negative netflow tells you that exchange inventory remains elevated, but the latest flow direction has begun changing.
These situations can reveal transitions before they become obvious in the slower metric.
The mistake is trying to choose which chart is “correct.”
They are measuring different time horizons.
This broader issue appears throughout on-chain research, which is why Why Most Investors Misread On-Chain Data focuses on understanding the mechanism behind a metric before turning it into a market prediction.
Stablecoins Reverse Part of the Interpretation
The stock-versus-flow logic remains the same for stablecoins, but the economic meaning changes.
For Bitcoin, rising spot exchange reserves mean more BTC sits within exchange infrastructure and is potentially available for sale.
For stablecoins, increasing exchange reserves can represent more purchasing power positioned close to crypto markets.
Stablecoin reserve shows the accumulated amount available within exchanges. Stablecoin netflow shows whether that amount is currently increasing or decreasing.
This is another reason simple rules such as “positive netflow is bearish” fail.
The metric structure may remain identical while the asset being measured changes what the movement actually means.
A Practical Decision Rule
Investors do not need dozens of exchange metrics for every market review.
Start with reserve to establish the structural direction. Then use netflow to identify whether recent behavior is reinforcing or challenging that structure.
If a recent flow moves against the reserve trend for only one or two sessions, treat it as an alert rather than a confirmed reversal. If the new flow direction persists long enough to flatten or reverse reserve while price and liquidity begin confirming the same supply shift, the signal becomes much more meaningful.
That is the key analytical distinction.
One large flow tells you something happened.
A changing reserve tells you that what happened lasted.
Final Thoughts
The difference between exchange reserve vs exchange netflow is ultimately the difference between state and change.
Exchange Reserve measures the accumulated amount of an asset held inside exchange-controlled addresses. Exchange Netflow measures whether that supply is currently being pushed higher or lower through the balance between deposits and withdrawals.
Neither metric is sufficient on its own.
Reserve can reveal a powerful structural trend while reacting slowly to recent changes. Netflow can identify those changes quickly while making a temporary event appear more important than it ultimately becomes.
Used together, they create a better sequence of questions: how much supply is sitting on exchanges, which direction is it moving now, whether that movement is persistent enough to alter the broader trend, and whether price and liquidity behave as though the change actually matters.
That is what turns two familiar CryptoQuant charts into a useful exchange flow analysis.