The best on-chain analytics tools for beginners are not necessarily the most advanced platforms.
That is the first mistake many new crypto investors make.
They open a professional analytics dashboard, see wallet flows, stablecoin charts, DEX volume, exchange reserves, liquidation data, protocol revenue, and smart money labels — then feel lost. More data does not automatically create better analysis.
For beginners, the goal is simpler:
Build a clean on-chain research workflow without drowning in metrics.
A good beginner stack should help answer practical questions:
- Did a transaction succeed?
- What did a wallet actually do?
- Is a protocol growing?
- Is liquidity improving?
- Are users active?
- Is volume supported by real activity?
- Are large wallets moving funds?
- Is a token or protocol worth deeper research?
The best on-chain analytics tools for beginners should make those questions easier to answer without forcing new investors into overly complex dashboards.
This article focuses on beginner-friendly tools that help investors move from surface-level crypto content toward evidence-based research.
The goal is not to copy professional traders.
The goal is to learn how to read blockchain activity with context.
Table of Contents
What Beginners Should Look for in On-Chain Analytics Tools
Before choosing tools, beginners should understand what each tool is supposed to solve.
On-chain analysis usually involves several layers:
| Research Need | Tool Type |
|---|---|
| Verify a transaction | Blockchain explorer |
| Check wallet activity | Explorer or wallet analytics |
| Track TVL and DeFi liquidity | DeFi dashboard |
| Compare chains | Chain analytics platform |
| Analyze protocol revenue | Fundamentals platform |
| Build custom dashboards | SQL analytics platform |
| Track smart money | Wallet intelligence platform |
A beginner does not need every tool immediately.
The best on-chain analytics tools for beginners are usually the ones that explain one part of the research process clearly, instead of trying to solve everything at once.
The better approach is to start with one tool per need, then expand as the analysis becomes more precise.
This is also why BlockCodex separates basic explorer usage from advanced interpretation in “Blockchain Explorers: 7 Powerful Ways to Read On-Chain Data Like a Pro” and “On-Chain Data: 7 Critical Reasons Most Investors Misread Blockchain Signals.”
The core principle is simple:
Use tools to answer questions, not to collect charts.
1. Etherscan: Best for Verifying Ethereum Transactions
Etherscan is usually the first tool beginners should learn.
It is not flashy, but it teaches the most important habit in crypto research: verification.
Etherscan describes itself as the leading blockchain explorer, search, API, and analytics platform for Ethereum and other EVM-compatible chains. It allows users to search transactions, addresses, tokens, blocks, and other Ethereum activity.
Beginners can use Etherscan to check:
- Transaction status;
- Wallet balances;
- ERC-20 token transfers;
- Smart contract interactions;
- Gas fees;
- Token approvals;
- Contract addresses;
- Exchange wallet movements.
This makes Etherscan especially useful for avoiding basic mistakes.
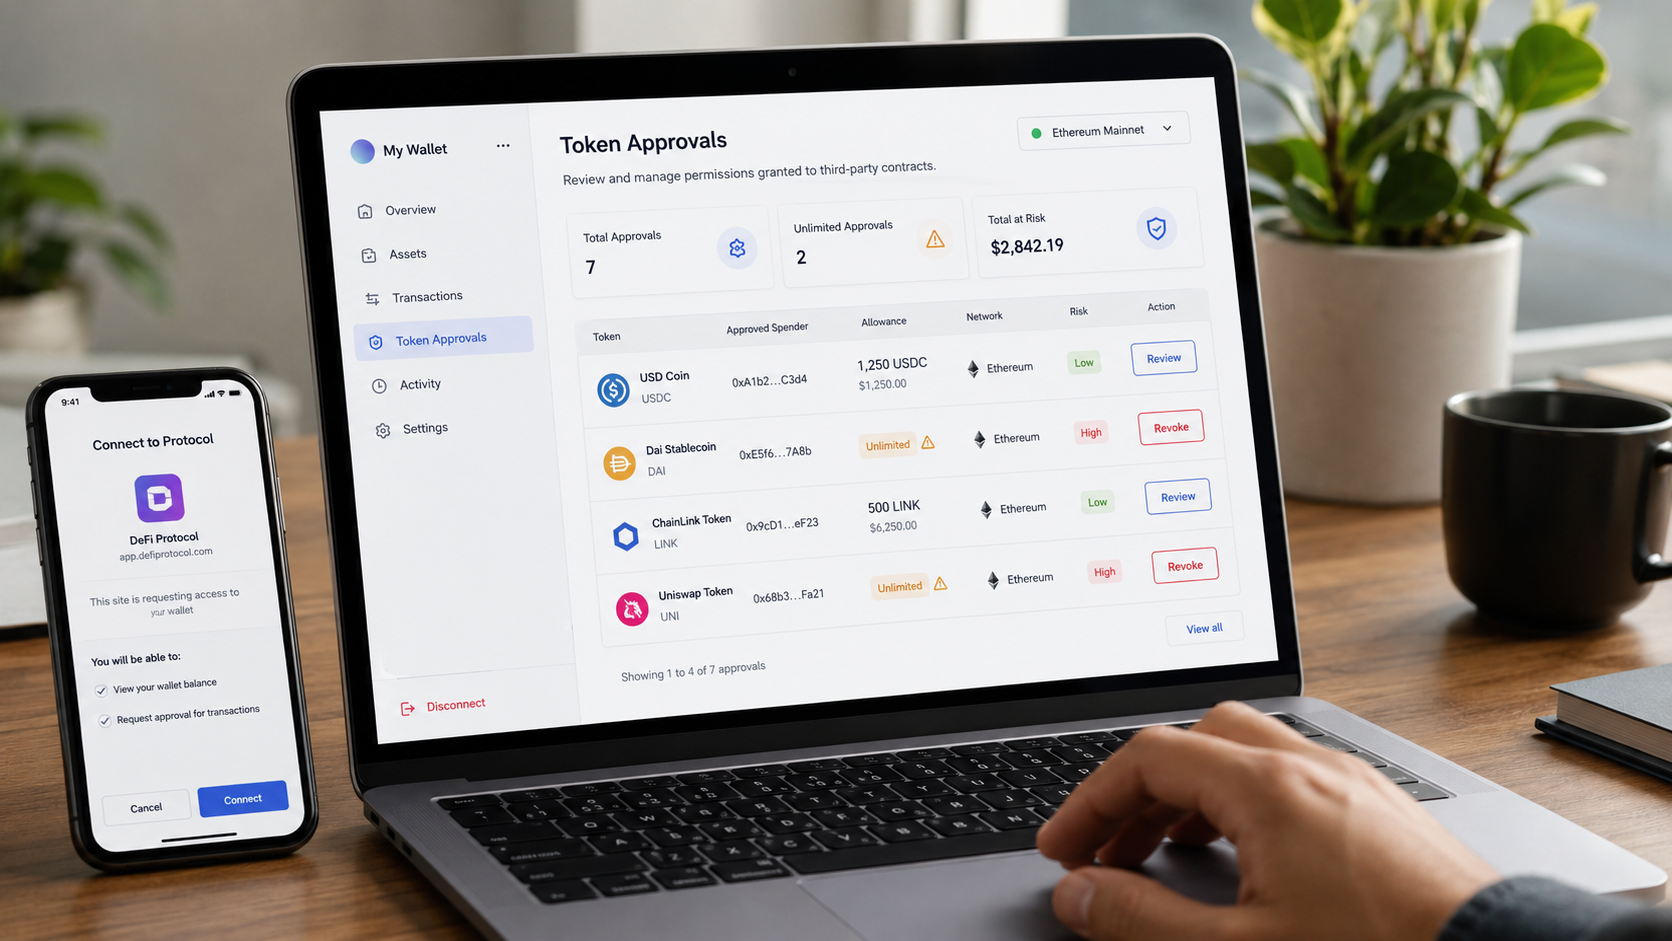
For example, if someone claims they sent tokens, Etherscan can verify whether the transaction actually happened. If a wallet receives an unknown token, Etherscan can help check the contract address. If a DeFi interaction looks suspicious, the token approval checker can reveal whether a contract still has permission to spend assets.
The main limitation is that Etherscan shows raw blockchain data. It does not always explain what the data means.
That is why beginners should treat Etherscan as a verification layer, not a full research dashboard.
For a practical walkthrough, see BlockCodex’s guide “How to Check Token Transfers on Etherscan: 7 Smart Steps for Investors.”
2. DeFiLlama: Best for TVL, DeFi Liquidity and Protocol Tracking
DeFiLlama is one of the easiest tools for beginners who want to understand DeFi activity.
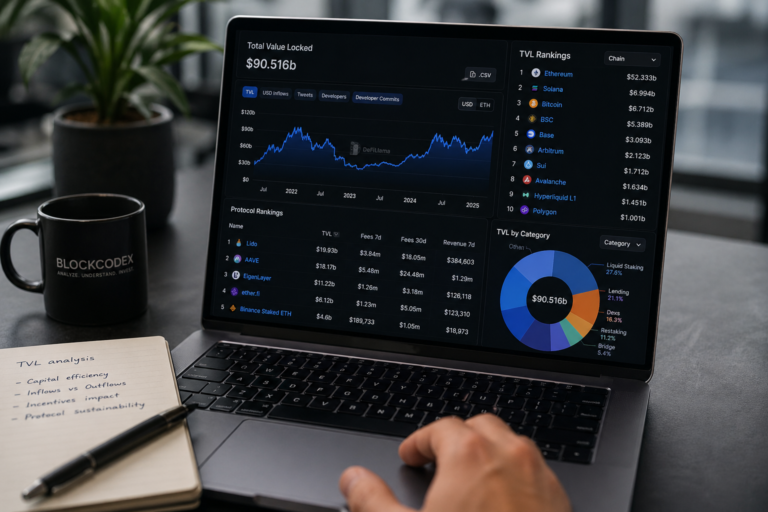
It tracks TVL, revenue, fees, volume, yields, and protocol data across thousands of DeFi protocols and hundreds of chains. DeFiLlama also has dedicated pages for chains, protocols, fees, revenue, stablecoins, and yields.
Beginners can use DeFiLlama to answer questions like:
- Which chains have the most DeFi liquidity?
- Is a protocol’s TVL rising or falling?
- Are fees growing with activity?
- Which protocols generate revenue?
- Which chains have deeper stablecoin liquidity?
- Is yield unusually high compared with similar protocols?
This makes DeFiLlama useful because it teaches beginners to compare capital presence with activity.
A protocol with rising TVL but weak fees may be less strong than it looks. A chain with high user activity but weak stablecoin liquidity may still struggle to support deep DeFi markets. A yield opportunity with high APY may be driven by incentives rather than real demand.
The main limitation is interpretation.
TVL is not the same as trust. Revenue is not always the same as long-term value. Yield is not always sustainable.
That is why DeFiLlama works best when paired with context from BlockCodex’s articles “How to Read TVL in Crypto: What It Really Signals About Capital and Risk” and “Liquidity in Crypto Markets: 7 Critical Misconceptions Investors Still Get Wrong.”
3. Dune: Best for Learning Custom On-Chain Dashboards
Dune is useful once beginners want to move beyond ready-made dashboards.
Dune’s documentation describes it as a platform where users can query, visualize, and share blockchain data through a web-based SQL editor and dashboard builder. Dune also says users can publish interactive dashboards across more than 100 chains.
For beginners, Dune is valuable because it teaches how on-chain metrics are built.
Instead of only reading a chart, users can often inspect the logic behind a dashboard, see the query, and understand what is being counted.
Dune is useful for:
- Ecosystem dashboards;
- Protocol usage;
- Token holder analysis;
- Airdrop dashboards;
- DEX activity;
- Stablecoin movement;
- NFT activity;
- Custom wallet or contract analysis.
The main drawback is that Dune can feel technical. SQL is not beginner-friendly for everyone.
But beginners do not need to write queries immediately. A good first step is to use public dashboards, compare them with other tools, and learn what each chart actually measures.
Dune is not the first tool a beginner should master, but it is one of the best tools for developing real on-chain literacy.
4. Nansen: Best for Wallet Labels and Smart Money Context
Nansen is more advanced than Etherscan or DeFiLlama, but it can be useful for beginners who want wallet context.
Nansen describes its platform as an on-chain intelligence tool for analyzing wallet flows, tracking key metrics, and identifying market activity. Its educational content also emphasizes wallet labels and smart money tracking as ways to understand wallet behavior rather than reading raw addresses in isolation.
This matters because wallet identity changes interpretation.
A transaction from a random wallet, an exchange wallet, a fund-labeled wallet, a smart money wallet, or a protocol treasury does not carry the same meaning.
Nansen can help users think in terms of:
- Wallet behavior;
- Fund flows;
- Smart money movements;
- Token accumulation;
- Exchange-related activity;
- Wallet clusters;
- Entity labels.
For beginners, the main benefit is context.
Instead of asking only “what address moved tokens?”, the better question becomes:
what kind of actor may be behind this activity?
Nansen’s limitation is cost and complexity. It is not always necessary for someone just learning how to read transactions. But it becomes more useful when investors start tracking whale activity, fund flows, and smart money behavior.
This makes it a natural upgrade after reading BlockCodex’s guide “How to Analyze Whale Activity: 7 On-Chain Signals Investors Should Track.”
5. Token Terminal: Best for Protocol Fundamentals
Token Terminal is useful for beginners who want to connect crypto protocols with business-style metrics.
Token Terminal describes itself as a platform for tracking historical on-chain metrics, including blockchain fees, revenue, and other key metrics across projects and chains. It also provides dedicated metrics pages for fees, revenue, and earnings.
This matters because many investors focus too much on token price and not enough on whether a protocol creates economic activity.
Beginners can use Token Terminal to ask:
- Does this protocol generate fees?
- Is revenue growing over time?
- Are users paying to use the application?
- How does one protocol compare with another?
- Is activity translating into economics?
This helps avoid a common crypto mistake: assuming usage automatically means value.
A protocol can be popular but unprofitable. Another can have smaller usage but stronger fee generation. A chain can process many transactions while producing limited economic value.
Token Terminal is not a full trading tool. It is more useful for fundamental research.
For beginners, it works best when paired with DeFiLlama and on-chain context.
6. Artemis: Best for Chain-Level Activity and Ecosystem Comparison
Artemis is useful for comparing blockchain ecosystems.
Its public materials describe it as a crypto investing terminal focused on metrics such as active addresses, transactions, fees, stablecoins, DEX activity, and chain-level comparisons.
This makes Artemis helpful for beginners trying to understand whether a chain is actually growing.
Instead of looking only at token price, beginners can compare:
- Active addresses;
- Transaction activity;
- Fees;
- Stablecoin activity;
- DEX volumes;
- Chain-level usage;
- Ecosystem trends.
This is useful for analyzing ecosystems such as Ethereum, Solana, Base, Arbitrum, or other chains.
The main limitation is that activity still needs interpretation.
High transactions do not always mean high-value usage. Active addresses do not always equal real users. Stablecoin growth does not always mean immediate buying pressure.
That is why Artemis is especially useful when combined with BlockCodex’s article “On-Chain Metrics: Why Market Context Is Critical for Crypto Analysis.”
7. CoinGecko: Best for Combining Market Data with On-Chain Research
CoinGecko is not only an on-chain analytics tool, but it is useful for beginners because it connects market context with crypto research.
Beginners often make the mistake of looking at on-chain metrics without checking price, liquidity, market cap, volume, token supply, and exchange listings.
CoinGecko can help with:
- Token market data;
- Price history;
- Market cap;
- Trading volume;
- Exchange listings;
- Token categories;
- Research reports;
- Ecosystem pages;
- Supply data.
This matters because on-chain analysis without market context can be misleading.
A protocol may show growing activity, but if liquidity is thin, token unlocks are large, or trading volume is concentrated on weak venues, the investment signal may be weaker than the on-chain chart suggests.
CoinGecko’s research pages also publish industry reports and market analysis that can help beginners understand broader market structure, not just wallet-level data.
CoinGecko should not replace blockchain tools. But it is useful as a market context layer.
That is why it fits well after beginners have learned to verify transactions with Etherscan and read DeFi data with DeFiLlama.
Which Best On-Chain Analytics Tools for Beginners Should You Use First?
Beginners should not start with every platform at once.
A simple order works better.
| Step | Tool | Why Start There |
|---|---|---|
| 1 | Etherscan | Learn how to verify transactions and wallet activity |
| 2 | DeFiLlama | Understand TVL, protocol activity, fees, and liquidity |
| 3 | CoinGecko | Add price, volume, market cap, and token context |
| 4 | Dune | Explore custom dashboards and learn how metrics are built |
| 5 | Token Terminal | Study protocol fundamentals and revenue |
| 6 | Artemis | Compare chain-level activity and ecosystem trends |
| 7 | Nansen | Add wallet labels, smart money, and flow context |
This order matters because beginners need foundations before advanced interpretation.
If someone cannot read a transaction on Etherscan, smart money dashboards may create confusion. If someone does not understand TVL, DeFi dashboards may be misread. If someone ignores market cap and liquidity, on-chain activity may look more meaningful than it is.
The goal is not to use more tools.
The goal is to use the right tool for the right question.
Best Beginner Workflow for On-Chain Research
A simple beginner workflow can look like this:
- Verify the asset
Use CoinGecko to check the token, market cap, volume, exchanges, and category. - Check the protocol or chain
Use DeFiLlama to review TVL, fees, revenue, yields, stablecoins, and chain activity. - Verify wallet or transaction activity
Use Etherscan to check transfers, approvals, contract interactions, and wallet history. - Compare activity over time
Use Artemis or Dune to observe active addresses, transactions, fees, DEX volume, or stablecoin movement. - Check whether activity creates economics
Use Token Terminal to compare fees, revenue, and protocol fundamentals. - Add wallet behavior if needed
Use Nansen when the question involves whale flows, smart money, or labeled wallets.
This workflow helps beginners avoid one of the biggest mistakes in crypto research: drawing conclusions from one chart.
A useful on-chain view usually comes from combining several layers.
Common Mistakes Beginners Make with On-Chain Analytics Tools
The tools are useful, but they can also create false confidence.
Common mistakes include:
- Treating active addresses as real users;
- Assuming TVL always means trust;
- Reading volume without liquidity;
- Following whale alerts without wallet context;
- Ignoring token approvals;
- Using Dune dashboards without checking definitions;
- Comparing protocols without checking incentives;
- Using smart money labels as automatic trade signals;
- Ignoring price, market cap, and exchange liquidity.
The biggest mistake is confusing access to data with understanding.
A beginner with five dashboards can still misread the market. A beginner with one tool and a clear question can learn faster.
That is why BlockCodex’s article “On-Chain Data: 7 Critical Reasons Most Investors Misread Blockchain Signals” is an important companion to any tool-based workflow.
How to Choose the Right Tool for Your Goal
Each tool has a different role.
| Goal | Best Beginner Tool |
|---|---|
| Verify a transaction | Etherscan |
| Check ERC-20 transfers | Etherscan |
| Analyze TVL and yields | DeFiLlama |
| Compare DeFi protocols | DeFiLlama |
| Explore custom dashboards | Dune |
| Track wallet labels | Nansen |
| Analyze protocol revenue | Token Terminal |
| Compare chain activity | Artemis |
| Add price and market context | CoinGecko |
Beginners should avoid tool overload.
A clean stack for the first month could be:
- Etherscan;
- DeFiLlama;
- CoinGecko.
Then add:
- Dune for custom dashboards;
- Token Terminal for fundamentals;
- Artemis for ecosystem comparison;
- Nansen for wallet intelligence.
That progression is more sustainable than trying to master everything at once.
In practice, the best on-chain analytics tools for beginners are not chosen by popularity alone, but by how clearly they answer a specific research question.
Conclusion
The best on-chain analytics tools for beginners are the tools that make blockchain activity easier to verify, compare, and interpret.
Etherscan helps verify transactions and wallet activity. DeFiLlama helps analyze TVL, fees, revenue, and liquidity. Dune helps users explore custom dashboards. Nansen adds wallet labels and smart money context. Token Terminal connects protocols to business-style fundamentals. Artemis helps compare chain-level activity. CoinGecko adds market context.
But tools do not replace judgment.
A dashboard can show active addresses, TVL, exchange flows, volume, or whale movement. It cannot automatically explain whether the activity is organic, durable, liquid, or investable.
For beginners, the best approach is simple:
Start with verification.
Add DeFi and market context.
Compare metrics across tools.
Avoid relying on one signal.
On-chain analysis is not about having the most dashboards.
It is about asking better questions with better evidence.