The spot vs perpetual volume crypto comparison is often reduced to a simple question: which market is more important?
That framing is misleading. Spot and perpetual markets do not measure the same type of activity, even when they track the same asset and display almost identical prices.
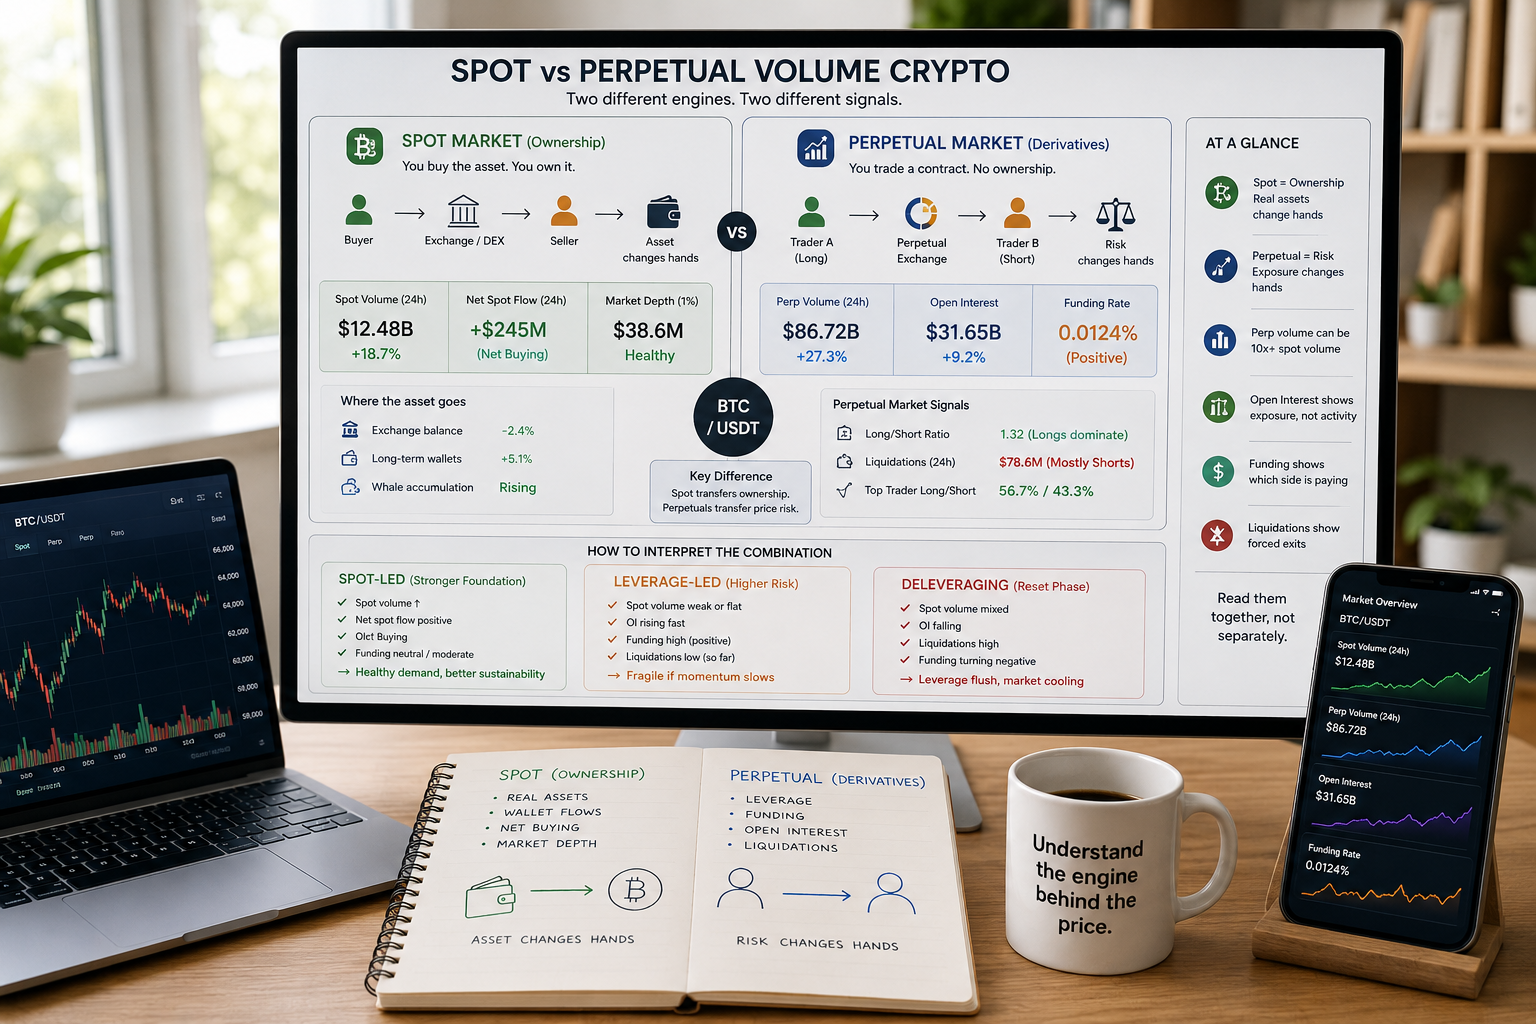
Spot volume records transactions in which the underlying asset changes hands. Perpetual volume records the turnover of derivative contracts that provide price exposure without requiring the trader to own the asset itself. One market transfers inventory; the other transfers risk.
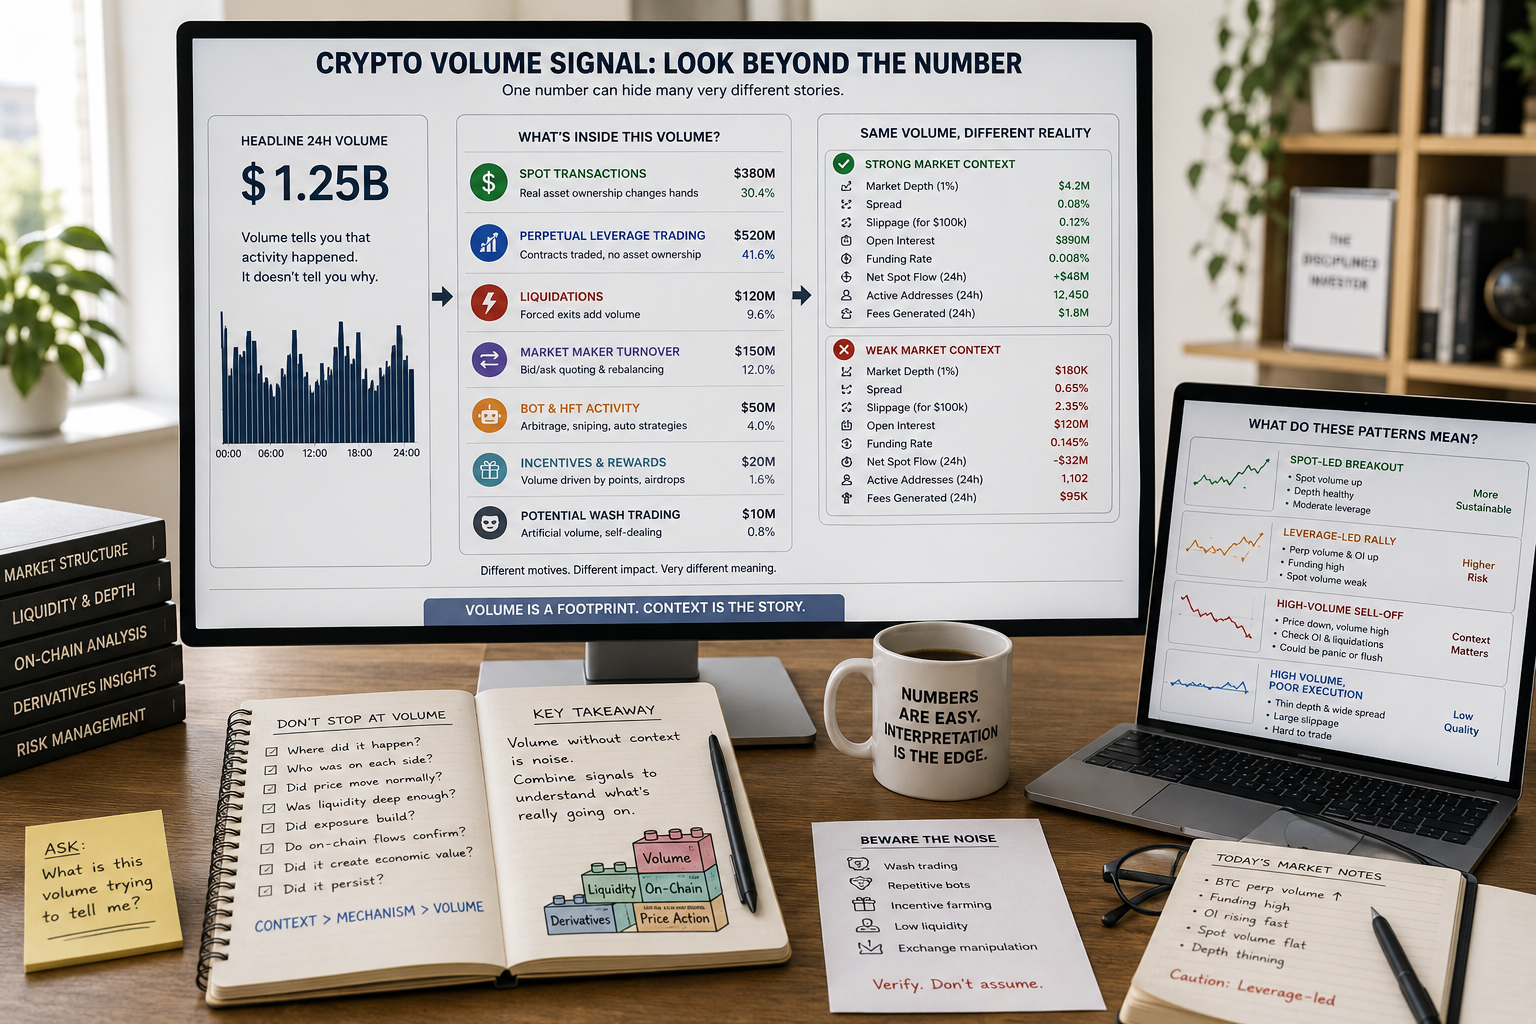
This distinction matters because perpetual volume can become several times larger than spot volume without representing several times more new capital entering the asset. Leverage, frequent position turnover, hedging, market making and liquidation activity can all generate substantial notional volume from a much smaller collateral base.
The scale of the derivatives market reflects this structure. CoinGecko recorded $86.2 trillion in centralized perpetual trading volume during 2025. In January 2026, combined centralized and decentralized perpetual volume reached $7.24 trillion, while centralized exchanges continued to dominate spot trading with more than $1 trillion in monthly volume and decentralized spot venues processed approximately $231 billion. Perpetual activity was therefore several times larger than spot activity, but the two figures described fundamentally different flows. (CoinGecko 2025 Annual Crypto Industry Report, CoinGecko CEX and DEX Trading Activity Report 2026)
The practical question is not which number is bigger.
It is what kind of market behavior created the volume.
Table of Contents
Spot vs Perpetual Volume Crypto: The Core Difference
A spot transaction changes ownership of an asset.
When an investor purchases one BTC on a spot exchange, the buyer receives exposure through actual BTC held in an exchange account or withdrawn to a wallet. The seller gives up that inventory in exchange for dollars, stablecoins or another asset.
A perpetual contract works differently. A trader opens a position linked to the price of BTC without purchasing the underlying coin. The position may be long or short, collateralized with stablecoins or crypto, and amplified with leverage.
| Feature | Spot Market | Perpetual Market |
|---|---|---|
| What is traded? | The underlying crypto asset | A derivative contract tracking the asset |
| Ownership changes? | Yes | No |
| Leverage | Usually absent or limited | Common |
| Expiration date | Not applicable | None |
| Funding payments | None | Periodic payments between longs and shorts |
| Liquidation risk | No forced liquidation without borrowing | Yes when margin becomes insufficient |
| Short selling | Requires borrowing or margin facilities | Built directly into the product |
| Main analytical value | Asset demand, supply and inventory movement | Leverage, positioning, hedging and speculative intensity |
Spot volume is closer to measuring asset turnover. Perpetual volume is closer to measuring how aggressively traders are exchanging price risk.
Neither is automatically more truthful.
They answer different questions.
Why Perpetual Volume Can Be Much Larger Than Spot Volume
Perpetual markets are structurally designed for high turnover.
A trader can open and close leveraged positions repeatedly without moving the underlying asset. Market makers trade continuously across exchanges to manage inventory and price differences. Hedged investors may hold spot assets while taking an opposite perpetual position, creating derivatives volume without changing their overall directional exposure.
The same collateral can also support several rounds of trading. A trader deposits $10,000, opens a leveraged position with a larger notional value, closes it and redeploys the remaining collateral. Every completed contract transaction contributes to volume even though the original capital base may not have changed significantly.
Perpetual contracts have no expiration date, so traders do not need to move between fixed monthly contracts to maintain exposure. Funding payments help keep the contract price close to the underlying spot index. When the perpetual trades above spot, funding generally becomes positive and longs pay shorts; when it trades below spot, funding can become negative and shorts pay longs. (Binance: What Are Funding Rates in Crypto Markets?)
These mechanics make perpetual markets efficient for speculation and hedging, but they also mean that one dollar of perpetual volume should not be interpreted as one dollar of fresh demand for the underlying token.
1. Spot Volume Shows Asset Exchange, Not Necessarily Long-Term Buying
Spot volume is often described as “real buying,” but that description is too generous.
A spot trade does involve the actual asset, yet every purchase has a seller. High spot volume shows that inventory is changing hands; it does not reveal whether buyers will hold the asset, withdraw it, trade it again or sell it minutes later.
Spot volume can come from:
- Long-term accumulation.
- Short-term trading.
- Arbitrage between venues.
- Market-maker activity.
- Portfolio rebalancing.
- Token conversions.
- Forced sales.
- Wash trading or low-quality exchange activity.
Its interpretation depends on price, liquidity and where the transactions occur.
Rising spot volume alongside an advancing price can suggest that buyers are absorbing available supply. The signal becomes stronger when spot market depth remains healthy, exchange balances decline or the asset is withdrawn into longer-term custody.
By contrast, a price increase accompanied by low spot volume may indicate that the move is occurring in a thin market. Even modest demand can push prices higher when nearby sell-side liquidity is limited.
This is why spot volume should be combined with the framework explained in Liquidity in Crypto Markets and What Is Market Depth in Crypto?. Historical turnover does not reveal how much liquidity is currently available for the next trade.
2. Perpetual Volume Measures Activity, Not Net Direction
A large perpetual volume figure does not tell investors whether the market is predominantly bullish or bearish.
Every contract trade has two sides. A new long position requires a short counterparty, while an existing position can be closed or transferred to another participant. The gross volume can rise sharply even when the market’s net directional exposure changes very little.
Perpetual volume may increase because traders are:
- Opening new leveraged positions.
- Closing existing positions.
- Rapidly trading short-term volatility.
- Hedging spot holdings.
- Arbitraging differences between exchanges.
- Responding to funding opportunities.
- Being liquidated.
- Rebalancing market-making inventory.
Volume alone cannot distinguish these motivations.
That is why perpetual volume should be read with open interest. Open interest measures the notional value of contracts that remain active rather than the contracts that have merely traded during the period.
The relationship between the two is more informative than either number alone.
3. Open Interest Reveals Whether Exposure Is Building or Being Recycled
Consider four simplified market situations:
| Perpetual Volume | Open Interest | Possible Interpretation |
|---|---|---|
| Rising | Rising | New leveraged exposure is entering |
| Rising | Falling | Positions are being closed or liquidated |
| Rising | Stable | High turnover without major net exposure growth |
| Falling | Rising | Positions are accumulating slowly with limited trading activity |
When both perpetual volume and open interest increase, traders are generally adding exposure rather than only exchanging existing contracts. The move can become more fragile if leverage grows faster than spot demand or available market depth.
When volume surges while open interest falls sharply, the market may be undergoing deleveraging. Positions are being closed voluntarily or through liquidation, producing heavy contract turnover as total outstanding exposure declines.
A stable open-interest figure alongside large volume suggests recycling. Traders are active, but the total amount of risk remaining in the system is not expanding proportionally.
Open interest therefore helps answer a question that perpetual volume cannot:
Is the market building new leverage or simply moving existing exposure between participants?
4. Funding Rates Show Which Side Is Paying to Maintain Exposure
Funding adds another layer to the analysis.
When demand for long exposure pushes the perpetual contract above its spot index, funding tends to become positive. Long traders then pay short traders periodically, creating an economic incentive for participants to take the opposite side and help pull the contract back toward spot.
Negative funding generally indicates stronger demand for short exposure, with shorts paying longs.
Funding should not be treated as a direct price prediction. A positive rate does not guarantee an imminent decline, and a negative rate does not guarantee a rebound. Persistent funding extremes are more useful as evidence that one side of the market is becoming crowded.
The strongest interpretation comes from combining funding with spot volume, price and open interest:
- Price rising, spot volume rising, open interest rising and moderate funding: broad participation with controlled leverage.
- Price rising, weak spot volume, rapidly rising open interest and extreme positive funding: a leverage-led move with higher liquidation risk.
- Price falling, rising open interest and increasingly negative funding: aggressive short positioning.
- Price falling, open interest collapsing and volume surging: probable long liquidation or broad deleveraging.
Funding reflects the cost of remaining positioned. It does not reveal whether the position is ultimately correct.
5. Perpetual Markets Can Move Spot Without Buying the Asset Directly
The statement that perpetual trading does not involve ownership can create another misunderstanding: that derivatives cannot influence the spot price.
They can.
Market makers operating in perpetual markets often hedge their exposure through spot markets or other derivatives. If traders aggressively buy perpetual contracts, the market maker taking the opposite side may purchase spot assets to reduce directional risk. Perpetual demand can therefore create indirect spot buying.
The opposite can occur during sell pressure.
Liquidations in perpetual markets can also produce rapid price movements. When leveraged positions fall below their maintenance requirements, the exchange or protocol closes them. Large waves of long liquidations create forced selling pressure in the derivatives market, while short liquidations create forced buying.
These movements can spread to spot markets through arbitrage. If the perpetual price moves below spot, traders may buy the discounted contract and sell spot until the gap narrows. When perpetuals trade above spot, the reverse trade can occur.
Spot is the inventory layer, but perpetuals frequently become the acceleration layer.
6. Spot–Perpetual Divergences Reveal the Quality of a Price Move
One of the most useful applications of the spot vs perpetual volume crypto framework is identifying divergences.
Spot Volume Leads the Move
When price rises with strong spot volume before perpetual activity expands, actual asset demand appears to be leading. Perpetual traders may enter later after recognizing the trend.
This type of move can be more durable because leverage is following underlying demand rather than creating it.
Perpetual Volume Leads While Spot Remains Weak
A rally dominated by perpetual volume, rapidly rising open interest and positive funding may depend heavily on leveraged traders. The price can continue rising, but the structure becomes more sensitive to liquidations and funding costs.
If spot buyers do not eventually appear, the market may struggle to absorb forced selling when leverage unwinds.
Spot Buying Continues While Perpetual Positioning Resets
Price consolidation with continued spot demand, falling open interest and normalized funding can indicate that excessive leverage is being removed without destroying underlying demand.
This is often healthier than a rally in which price, funding and open interest rise continuously together.
Perpetual Selling Surges but Spot Remains Stable
If perpetual volume spikes during liquidations while spot markets maintain depth and recover quickly, the event may be primarily a leverage reset rather than a complete collapse in investor demand.
The distinction matters because visually similar price drops can have very different causes.
One may represent holders selling the underlying asset. Another may reflect forced derivatives closures in an overleveraged market.
7. Spot and Perpetual Volume Can Both Be Misleading
Neither market is immune to poor-quality data.
Spot volume can be inflated through wash trading, repetitive transactions, weak exchange controls or internal market-making activity. Perpetual volume can also be concentrated on venues with aggressive incentives, low fees or activity that does not reflect broad market participation.
Investors should review:
- Venue reputation.
- Order-book depth.
- Spread stability.
- Volume concentration.
- Open-interest quality.
- Liquidation data.
- Funding consistency.
- Price alignment with larger exchanges.
- Whether activity persists after incentives decline.
A token reporting enormous volume but offering little executable depth deserves scrutiny. The same applies to a perpetual contract with high turnover but limited open interest, unstable funding and poor liquidity around the mark price.
BlockCodex explains the warning signs in How to Identify Fake Volume in Crypto.
Volume becomes more credible when it is supported by real market depth, stable execution and consistent activity across independent venues.
Spot Volume vs Perpetual Volume Across a Market Cycle
The relationship between spot and perpetual markets often changes as a cycle develops.
Early Accumulation
During quieter periods, spot investors may gradually accumulate while perpetual volume and open interest remain moderate. Funding is often neutral because leveraged traders have not yet crowded into the trend.
The market can appear inactive even while ownership is shifting toward stronger buyers.
Breakout and Expansion
As price breaks out, both spot and perpetual volumes may rise. Spot demand validates the move, while derivatives provide additional liquidity, hedging and speculation.
The structure remains healthier when funding stays controlled and open interest grows proportionally rather than vertically.
Speculative Acceleration
Later in a rally, perpetual volume may expand much faster than spot. Positive funding, rising leverage and crowded long positioning can push prices higher, but the market becomes increasingly dependent on continued momentum.
A pause can then trigger a chain of liquidations.
Deleveraging
During a sharp correction, perpetual volume may surge as open interest collapses. Forced position closures generate extreme activity while spot holders may remain relatively passive.
The market’s ability to recover depends partly on whether spot demand and market depth remain intact after leverage has been removed.
Reaccumulation or Distribution
After the liquidation phase, spot activity becomes important again. Continued buying may support reaccumulation, while persistent spot selling can indicate broader distribution rather than a temporary derivatives reset.
This sequence connects naturally with the framework in Crypto Market Cycles Explained With On-Chain Data. Derivatives reveal positioning and leverage, while spot and on-chain data help show whether underlying ownership is changing.
CEX vs DEX Spot and Perpetual Volume
The venue also matters.
Centralized exchanges still dominate both spot and perpetual trading, but decentralized venues have gained market share. CoinGecko reported that decentralized exchanges represented 13.6% of spot volume in January 2026, up from 6.9% in January 2024. Decentralized perpetual platforms reached 10.2% of perpetual volume in January 2026, compared with 2% two years earlier. (CoinGecko CEX and DEX Trading Activity Report 2026)
CEX volume is usually based on internal order books and exchange-reported trades. DEX spot volume is recorded through on-chain pools or order books, while decentralized perpetual platforms may use on-chain settlement, off-chain matching or hybrid designs.
These differences affect interpretation.
DEX spot volume can be transparent at the transaction level, yet it may be distorted by routing, arbitrage or incentive programs. CEX volume may provide deeper liquidity but depends more heavily on the exchange’s reporting quality. Perpetual DEX volume can show genuine on-chain adoption while remaining concentrated among sophisticated, high-frequency participants.
Comparisons should therefore use consistent definitions and clearly identify the venue set being measured.
A Practical Spot vs Perpetual Volume Crypto Workflow
A useful analysis can be built in eight steps.
1. Define the Asset and Venue
Compare the exact spot pair and perpetual contract rather than mixing unrelated exchanges, currencies or networks.
2. Review Spot Volume
Check whether spot activity is rising, falling or concentrated on one venue. Compare the volume with market depth and price direction.
3. Review Perpetual Volume
Determine whether derivatives activity is expanding faster than spot and whether the increase is persistent or event-driven.
4. Add Open Interest
Check whether outstanding exposure is increasing, decreasing or remaining stable.
5. Review Funding
Look for persistent positive or negative rates and compare them with the direction of price and open interest.
6. Check Liquidations
A volume spike accompanied by falling open interest and large liquidations often reflects forced deleveraging rather than voluntary new positioning.
7. Examine Market Depth
Determine whether the spot and perpetual markets can absorb the observed activity without severe price impact.
8. Write the Interpretation
The conclusion should describe the market structure rather than repeat the figures.
For example:
Price is rising with strong perpetual volume and rapidly increasing open interest, but spot volume remains moderate and funding is becoming expensive. The move appears increasingly leverage-led, which raises the risk of a liquidation-driven reversal if spot demand does not strengthen.
That conclusion is more useful than saying only that volume is bullish.
Common Interpretation Mistakes
Assuming Perpetual Volume Represents New Capital
Large notional turnover can be generated from a smaller collateral base through leverage and repeated trading.
Treating Spot Volume as Automatic Accumulation
Spot volume records asset exchange, but buyers may be short-term traders rather than long-term holders.
Ignoring Open Interest
Perpetual volume cannot show whether exposure is being opened, closed or recycled.
Reading Funding as a Standalone Signal
Positive funding can persist during strong trends, while negative funding can remain negative during prolonged declines.
Ignoring Liquidations
Forced closures can create extraordinary volume that says more about leverage than voluntary market conviction.
Combining Unrelated Venues
Spot and perpetual data should cover comparable assets, time periods and credible exchanges.
Ignoring Depth
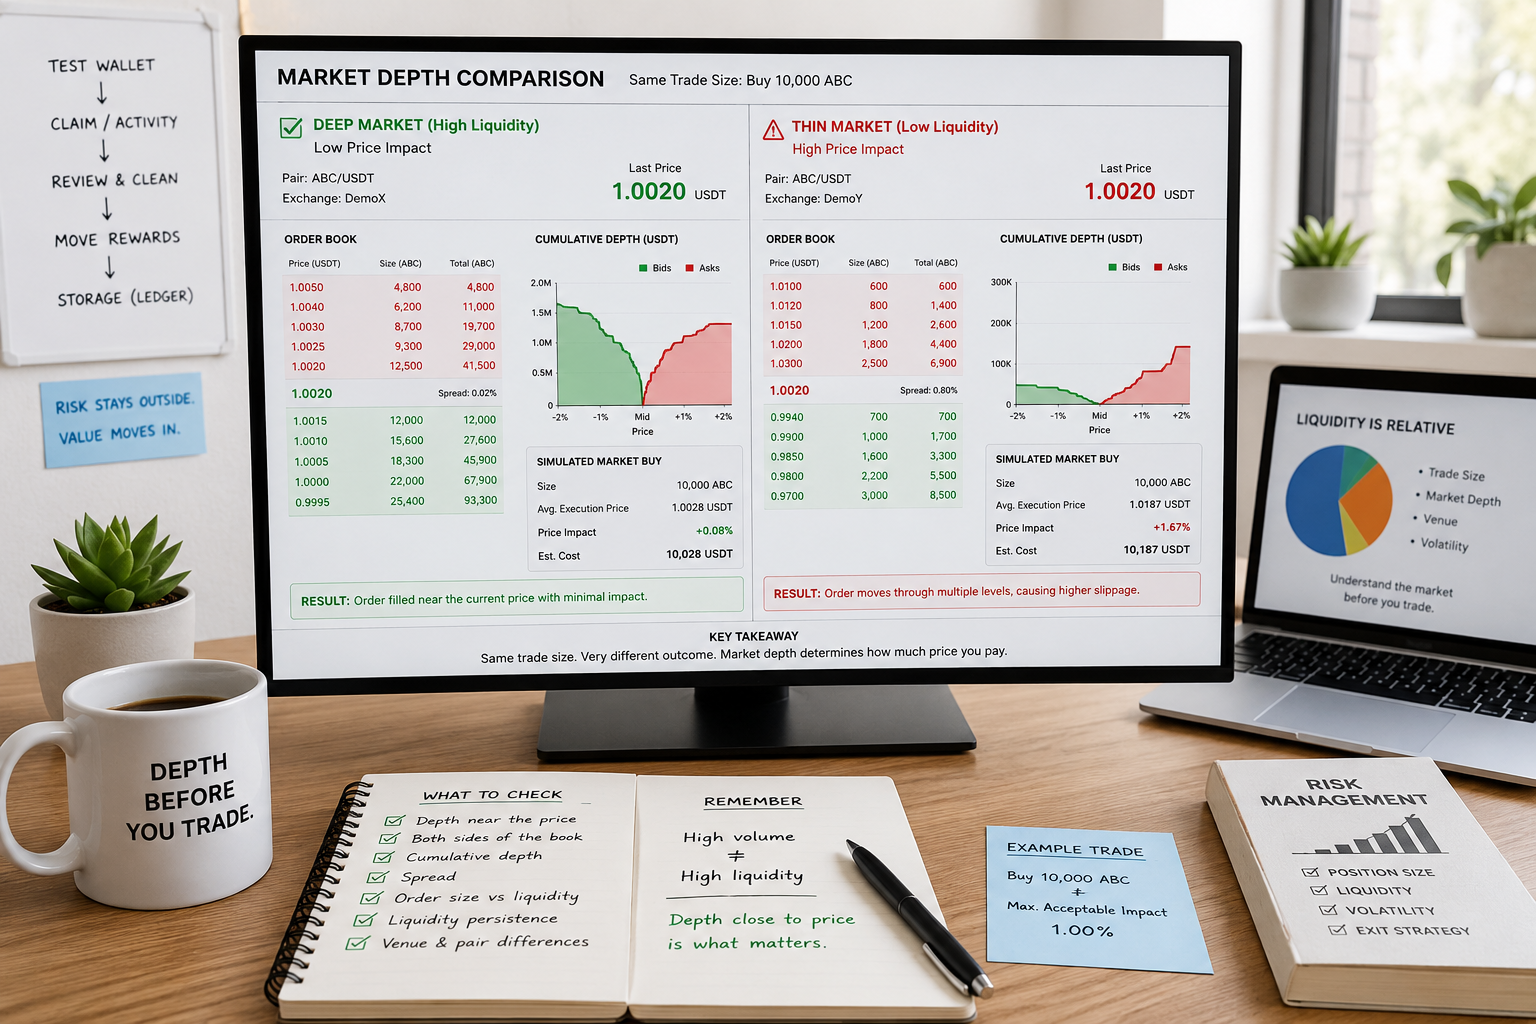
A market can report large volume while offering poor execution for a realistically sized order.
Final Thoughts
Spot and perpetual volumes describe two different engines inside the crypto market.
Spot markets transfer ownership. They reveal where the underlying asset is being exchanged and whether buyers can absorb available inventory. Perpetual markets transfer price risk, allowing traders to speculate, hedge and use leverage without owning the underlying token.
The derivatives market often produces much larger volume because positions can be opened, closed and recycled rapidly. That does not make the activity meaningless, but it changes what the figure represents. Perpetual volume becomes useful only when it is combined with open interest, funding, liquidations and spot-market behavior.
The strongest price moves usually show some degree of confirmation between the two markets. Spot demand provides the inventory support, while perpetual activity adds liquidity and risk transfer without becoming excessively crowded.
When derivatives activity expands far faster than spot demand, the market can continue moving, but its stability becomes increasingly dependent on leverage. When that leverage reverses, volume may surge even as open interest collapses.
The goal is not to decide whether spot or perpetual volume is more important.
It is to identify which market is driving the move, what kind of exposure is building, and how the structure may behave when traders attempt to exit.