Crypto growth after incentives is difficult to measure from headline participation figures alone. When Optimism Quests ended on January 17, 2023, after nearly four months of tutorials, on-chain tasks, and commemorative NFTs, more than 456,000 participating addresses had minted at least one Quest NFT.
That figure demonstrates the campaign’s reach, but it does not reveal whether Optimism gained durable users, temporarily rented wallet activity, or experienced both at the same time.
To answer that question, this analysis compares active addresses, DEX volume, network fees, and DeFi liquidity across four equal periods before, during, and after Optimism Quests. It also uses Arbitrum as a market control to avoid attributing every post-campaign change to the incentives themselves.
The result is mixed, which is exactly why growth after incentives needs more than one chart.
The short answer
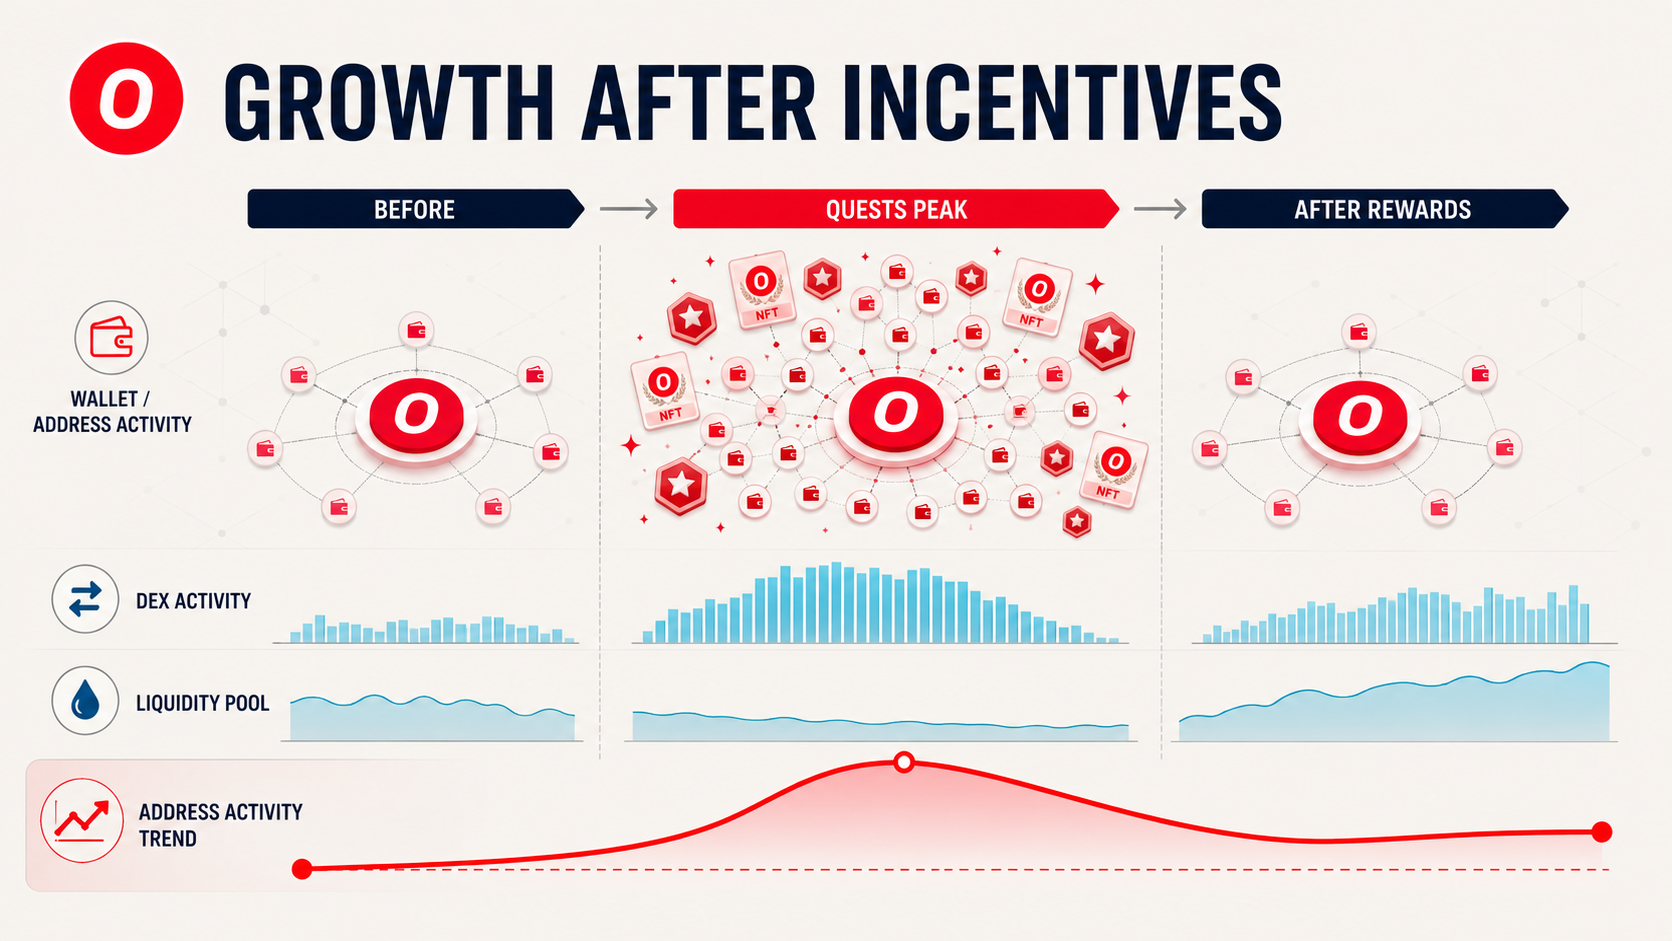
Optimism did not keep its full incentive-driven peak. Average daily active addresses fell from roughly 66,900 during the campaign’s strongest 28-day period to 31,500 in the first 28 days after it ended, a 53% decline.
However, activity did not return to the pre-campaign baseline of about 13,900 daily active addresses. In a later 28-day window, average daily activity reached approximately 45,200 addresses. That was still 226% above the baseline, although it cannot be credited entirely to Quests because Optimism Airdrop 2, changing market conditions, and other ecosystem developments affected the post-campaign period.
The economic data is less flattering to the peak. During the period with the most active addresses, DEX volume was 52% below its pre-campaign level and average DeFi TVL was 40% lower. Optimism generated substantially more network fees, but the campaign’s user spike did not arrive with a matching increase in trading volume or committed capital.
The defensible verdict is that Optimism Quests rented a meaningful share of its peak activity while leaving behind a higher aggregate usage floor. The data does not prove that the same Quest participants stayed, and evidence from one participating application suggests many did not.
Why incentive-driven growth is easy to misread
An incentive campaign changes user behavior before it changes product-market fit. Rewards lower the effective cost of trying an application, while a potential future airdrop can make even a low-value transaction economically rational.
That mechanism can improve discovery. A user who would never have crossed a bridge, opened a lending position, or traded on a new DEX may finally learn how the product works. But the same mechanism attracts farmers who optimize for eligibility rather than utility.
Aggregate activity mixes these groups together. A dashboard cannot tell whether 50,000 active addresses represent 50,000 people, whether one person controls many wallets, or whether the wallets intend to return after the reward disappears.
This is why the broader BlockCodex framework on crypto ecosystem growth signals treats users, liquidity, applications, developers, and fees as connected evidence rather than interchangeable proof. Incentives can raise one signal while the rest of the system remains unchanged.
The case study: Optimism Quests
Optimism Quests ran from September 20, 2022, through January 17, 2023. Participants learned about applications in the Optimism ecosystem, completed specified on-chain actions, and minted NFTs documenting completion. The dates were later included in the Optimism Collective’s official “Quester” criterion for Airdrop 5.
Galaxy Research reported that more than 456,000 addresses minted at least one Quest NFT. It also found that the most-used applications on Optimism near the end of 2022 were closely tied to the campaign, showing that Quests materially shaped where network activity occurred.
The campaign therefore gives us a useful completed event. It has a defined start and end, visible user acquisition, participating applications, and enough post-campaign history to evaluate what happened after the call to action disappeared.
Methodology: four equal windows, four different signals
The comparison uses 28-day windows so weekday effects are balanced and every phase contains the same number of observations.
| Phase | Dates | Why this window was selected |
|---|---|---|
| Pre-campaign baseline | Aug. 23–Sept. 19, 2022 | The final 28 days before Quests began |
| Campaign peak | Dec. 21, 2022–Jan. 17, 2023 | The highest 28-day average of daily active addresses during the campaign |
| Immediate post-campaign | Jan. 18–Feb. 14, 2023 | The first 28 days after Quests ended |
| Later post-campaign | Feb. 15–Mar. 14, 2023 | A second 28-day observation window after the initial drop |
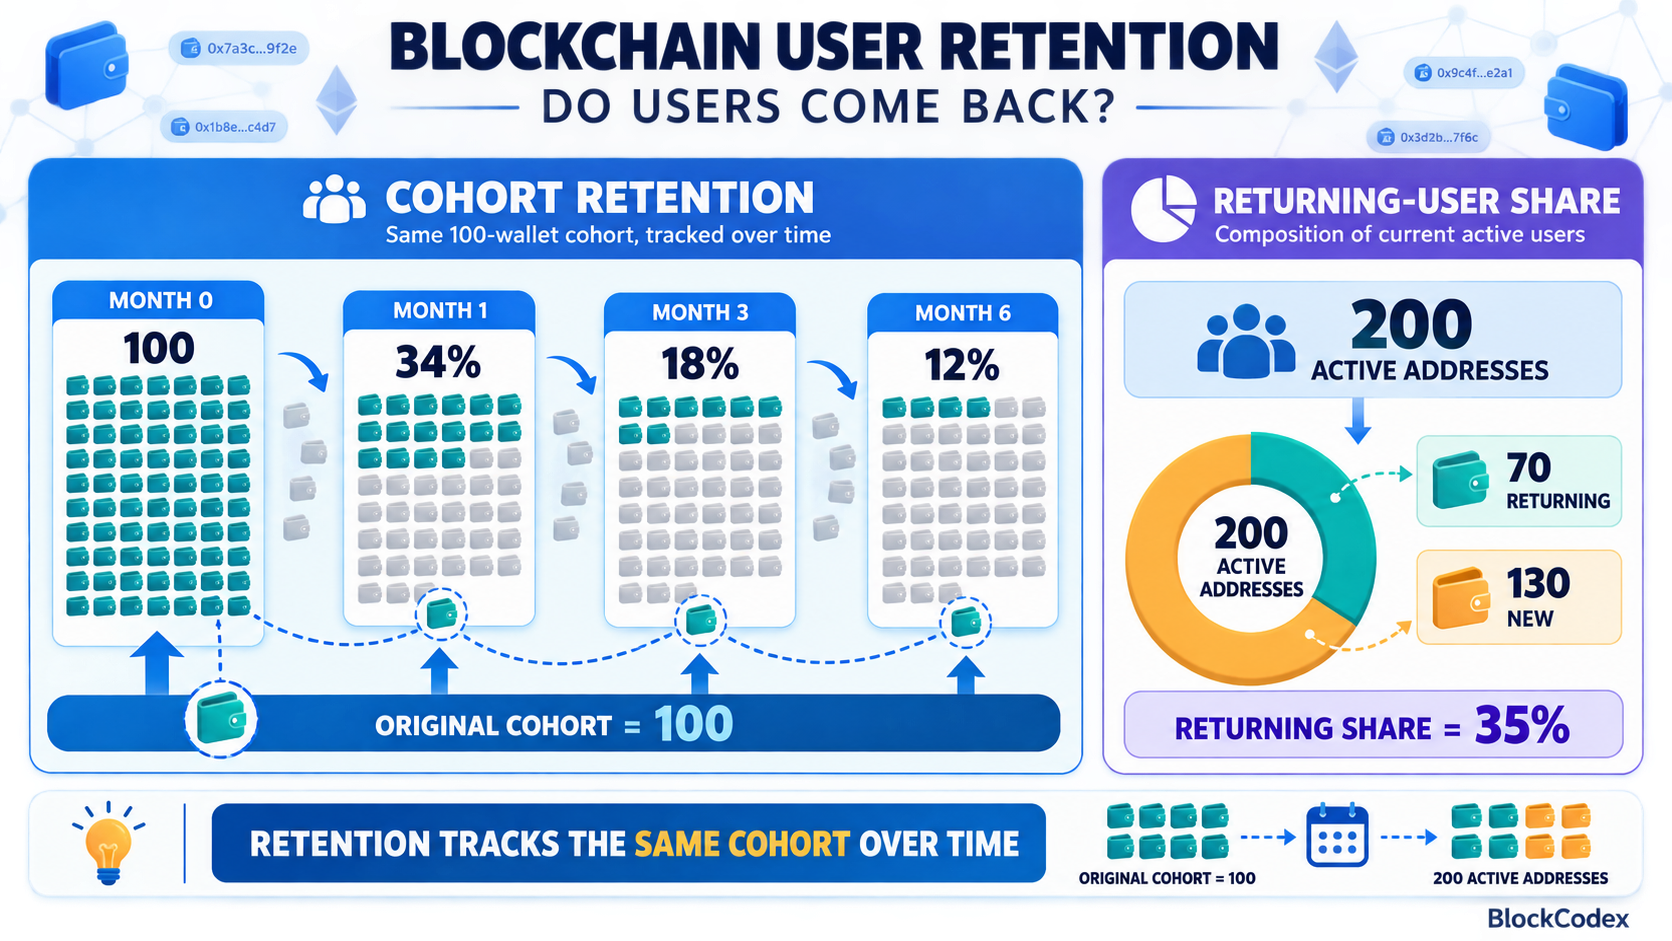
“Users” means unique sending addresses active on a given day, averaged across the window. It does not mean verified people, and it is not a cohort-retention rate.
DEX volume and fees are summed across each 28-day period. DeFi TVL is the average of the daily observations, which reduces the influence of a single closing-day move. The calculations use daily historical data from growthepie for active addresses and network fees, and DefiLlama for DEX volume and DeFi TVL.
Historical data was rechecked on August 26, 2026. Both providers can revise old observations as labels, prices, and adapters improve, so the methodology matters more than false precision in the final digit.
What happened before, during, and after the incentives
| Metric | Pre-campaign | Campaign peak | Immediate post | Later post |
| Avg. daily active addresses | 13,856 | 66,895 | 31,468 | 45,226 |
| DEX volume, 28-day total | $1.95B | $934M | $2.12B | $1.96B |
| Network fees, 28-day total | $502K | $2.12M | $1.39M | $2.25M |
| Network fees, ETH | 315 ETH | 1,608 ETH | 867 ETH | 1,414 ETH |
| Avg. DeFi TVL | $868M | $517M | $695M | $873M |
The campaign peak produced 4.8 times the baseline number of daily active addresses and 4.2 times the network fees in dollar terms. Those two measures confirm that Quests coincided with a real increase in wallet activity and blockspace demand.
But the other two signals moved in the opposite direction. DEX volume fell by 52% from baseline to peak, while average DeFi TVL fell by 40%. The new activity was broad in address count but shallow in capital commitment.
The first post-campaign window then separated the temporary component from the stronger baseline. Daily active addresses fell 53% from the peak, and fees declined 35%. At the same time, DEX volume more than doubled relative to the peak and TVL began to recover, even with fewer active wallets.
By the later post-campaign window, average daily addresses had recovered to 45,226, fees exceeded the campaign peak in USD, DEX volume was almost identical to the original baseline, and TVL had returned to roughly $873 million. Optimism was larger than before Quests by activity, but the composition of that activity had changed.
The retention ratios reveal the shape of the growth
A simple aggregate retention proxy divides post-campaign activity by peak activity. It is useful for diagnosing the network’s new floor, but it must not be confused with following the same wallets over time.
| Derived measure | Result | Interpretation |
| Immediate activity retained vs. peak | 47% | More than half of the peak disappeared in the first 28 days |
| Later activity retained vs. peak | 68% | Aggregate activity recovered, but not to the campaign high |
| Later activity vs. pre-campaign baseline | 3.26× | The network established a materially higher usage floor |
| DEX volume per active-address day: pre | ~$5,025 | High trading value relative to address activity |
| DEX volume per active-address day: peak | ~$499 | A roughly 90% collapse in trading intensity per address-day |
| DEX volume per active-address day: later post | ~$1,548 | Partial recovery, still about 69% below baseline |
The economic-density calculation is deliberately simple: 28-day DEX volume divided by average daily active addresses and then by 28 days. Because the numerator and denominator come from different datasets, it should be used directionally rather than as an exact unit-economics measure.
The direction is still informative. Optimism acquired many more active addresses during Quests, but each address-day was associated with far less DEX volume. That pattern is consistent with small task-completion transactions, educational exploration, or farming behavior rather than a proportional expansion in trading demand.
Network fees tell a more constructive story. Fees per active-address day were about $1.29 before the campaign, $1.13 at the peak, $1.58 immediately afterward, and $1.78 in the later post period. The activity was not costless spam, although fees also reflect congestion, transaction complexity, and the fee model—not just user value.
Why aggregate activity is not user retention
Suppose 60,000 wallets are active during an incentive campaign and 40,000 are active two months later. That does not mean two-thirds of the original wallets stayed. The later total could include 10,000 retained campaign wallets and 30,000 entirely new wallets.
True retention requires cohorts. Analysts must identify wallets first acquired in a particular period and calculate what share performs another meaningful action after 7, 30, 60, or 90 days. The action should match the application’s business model: a second trade for a DEX, another borrowing or repayment event for a lending market, or continued liquidity for a pool.
Token Terminal’s Synthetix cohort analysis provides a useful application-level check. It found an increase in absolute users alongside a periodic decline in retention among cohorts acquired during Optimism Quests, and interpreted those users as likely incentive farmers. That is stronger evidence than a network total because it follows fee- or revenue-generating users of a specific protocol over time.
It is not proof that every departing address was a farmer, nor does one Synthetix cohort describe every application on Optimism. It does show why a higher network floor cannot be treated as direct evidence that the campaign’s original users stayed.
The capital signals contradict the user spike
Capital is not a perfect measure of utility, but durable DeFi growth normally leaves some trace in liquidity, trading depth, stablecoin balances, or repeat fee-generating actions. Optimism’s peak user window did not produce that confirmation.
Galaxy Research noticed the same disconnect in real time. Its January 2023 report said Optimism TVL measured in ETH had declined through November and December even as addresses and transactions increased. It also observed that average trade sizes at campaign-participating DEXs had become progressively smaller.
Our 28-day comparison extends that observation through the end of the campaign. The highest active-address period had the lowest DEX volume and lowest average TVL of all four windows. Activity was growing faster than economically committed usage.
This does not make the campaign worthless. A tutorial transaction is expected to be smaller than an established trader’s normal activity. The important point is that acquisition volume and economic depth answer different questions, and a successful onboarding campaign should not be evaluated as though they were the same metric.
The Arbitrum control weakens a clean causal claim
Crypto markets do not hold still while an incentive campaign runs. Token prices change, volatility creates trading demand, applications launch, and competing chains run their own growth programs. A before-and-after chart can therefore assign market-wide changes to the wrong cause.
Arbitrum is not a perfect control, but it is a useful contemporaneous benchmark. It was another major optimistic rollup serving many of the same users and applications. On the same baseline and later post-campaign windows, its growth was at least as strong as Optimism’s across the four selected metrics.
| Change from pre-campaign to later post window | Optimism | Arbitrum |
| Avg. daily active addresses | +226% | +240% |
| Network fees | +348% | +517% |
| DEX volume | +0.6% | +347% |
| Avg. DeFi TVL | +0.6% | +99% |
This comparison does not prove Quests had no durable effect. Arbitrum had its own catalysts, including application growth and expectations around a future token. It does show that the early-2023 rebound was not unique to Optimism, so the entire post-campaign lift cannot be attributed to Quests.
Optimism Airdrop 2 is another confounder. On February 9, 2023, the network distributed 11.7 million OP to more than 300,000 addresses, overlapping with the immediate post-campaign window. Later activity therefore reflects an ecosystem that was still being actively stimulated, not a laboratory in which all incentives had disappeared.
A better framework for measuring crypto growth after incentives
The lesson is not to ignore active addresses. It is to place them in a measurement sequence that makes manipulation and misinterpretation harder.
1. Freeze the campaign boundaries
Record the announcement date, start date, reward changes, snapshot date, and end date before looking at the chart. If analysts move the window after seeing the result, they can manufacture almost any narrative.
Use equal-length periods and include both an immediate post window and a delayed window. The first captures the withdrawal shock; the second tests whether the ecosystem established a higher floor after short-term participants left.
2. Separate addresses from people
Count active sending addresses, but label them accurately. Then add sybil indicators such as funding-source concentration, synchronized transactions, repeated task paths, low balances, and clusters of wallets that empty shortly after the campaign.
No filter will perfectly recover the number of humans. The goal is to measure how sensitive the growth claim is to obvious multi-wallet behavior.
3. Build real acquisition cohorts
Create cohorts from first meaningful use, not from the first wallet transaction. A swap, loan, bridge transfer, or liquidity deposit is more informative than an approval or NFT mint performed only to finish a task.
Measure 7-, 30-, 60-, and 90-day return rates. Also compare retained users with a matched group that arrived without the campaign, because naturally acquired users may have very different intent.
4. Track economic depth with usage
Pair retention with fees, volume, TVL, stablecoin balances, and liquidity depth. A user count that stays high while transaction value and liquidity collapse may represent cheap repetitive activity rather than a stronger ecosystem.
The BlockCodex guide to whether a blockchain ecosystem is growing explains why no single metric can carry the conclusion. For incentive analysis, the crucial test is whether multiple signals remain above baseline after emissions stop.
5. Measure distribution, not just totals
Ask which applications retained users and capital. An ecosystem-wide total can hide a campaign where one protocol succeeds, several lose nearly every acquired user, and a separate new application creates the apparent recovery.
Useful distribution measures include the share of activity held by the top five contracts, median transaction value, median wallet balance, repeat activity across more than one application, and the share of liquidity that remains after rewards end.
6. Add a control and list every confounder
Compare the target ecosystem with similar chains that did not run the same campaign. A simple control is better than none, while a matched-wallet design or synthetic control is stronger when the data supports it.
Document airdrops, upgrades, token launches, major application releases, exploits, and market-wide volatility. The purpose is not to eliminate uncertainty from observational data; it is to prevent certainty that the design cannot justify.
7. Demand a stronger verdict than “numbers went up”
A useful campaign verdict should distinguish at least three outcomes:
- Rented growth: activity falls near baseline, cohorts churn, and capital leaves when rewards stop.
- Converted growth: campaign cohorts return without rewards, fees remain economically meaningful, and liquidity or transaction value stays above baseline.
- Mixed growth: part of the peak disappears, but some applications or user segments establish a higher durable floor.
Optimism Quests fits the mixed category. That conclusion is less dramatic than calling the campaign either a triumph or a failure, but it is more faithful to the evidence.
What the Optimism case teaches investors
Peak growth should be treated as acquisition inventory, not as retained demand. Until a cohort has returned after the reward ends, the campaign has created an opportunity to retain a user—not a retained user.
Investors should also watch whether economic value grows at the same rate as addresses. In this case, the tenfold decline in DEX volume per active-address day from baseline to peak was more revealing than the address record itself.
Finally, better dashboards do not solve weak experimental design. As BlockCodex explains in why better crypto research tools can still create worse decisions, clean charts can make an unsupported causal story look precise. The difficult part is choosing the right denominator, time window, cohort, and control.
Final verdict: did Optimism keep the users it acquired?
Optimism kept a higher level of aggregate activity after Quests, but the available evidence does not show that it retained most of the same campaign-acquired users. The immediate 53% decline from the active-address peak and the Synthetix cohort pattern indicate that a meaningful share of participation was temporary.
At the same time, activity and fee generation remained well above the original baseline, while DEX volume and TVL later recovered. That outcome is better than a complete return to pre-campaign conditions, but the similar or stronger growth on Arbitrum and the overlap with Optimism Airdrop 2 prevent a clean causal attribution.
The most defensible answer is therefore conditional: Optimism appears to have converted some incentive-driven attention into a larger ecosystem, but it rented much of the campaign peak. The durable part is visible in the higher floor; the rented part is visible in the post-campaign drop and weak economic density at the peak.
That is how crypto growth after incentives should be measured. Do not ask only how high the chart went. Ask who returned, what value they created, how much capital stayed, and whether the same growth appeared elsewhere without the campaign.
Frequently asked questions
What is crypto growth after incentives?
Crypto growth after incentives is the activity, capital, and economic demand that remain after rewards, points, emissions, or airdrop-related tasks end. It is more informative than peak campaign activity because it tests whether users found a reason to return without the original subsidy.
How do you measure blockchain user retention?
Create a cohort of wallets acquired during a defined period and measure how many perform another meaningful action after 7, 30, 60, or 90 days. Network-wide active-address totals are useful context, but they cannot prove that the same wallets stayed.
Does higher TVL prove that an incentive campaign worked?
No. TVL can rise because asset prices increase, capital moves between protocols, or rewards temporarily attract deposits. A stronger conclusion requires liquidity to remain after rewards end and to support continued volume, fees, borrowing, or other application demand.
Are active addresses the same as users?
No. One person can control multiple addresses, and automated systems can create or operate wallets. Active addresses should be treated as observable accounts, then evaluated with sybil filters, cohort behavior, balances, transaction value, and repeat usage.
How long should analysts wait after a campaign ends?
Use more than one post-campaign window. An immediate 28- or 30-day period captures the withdrawal shock, while later 60- and 90-day checks show whether activity stabilizes, recovers through genuine product use, or depends on a new incentive.