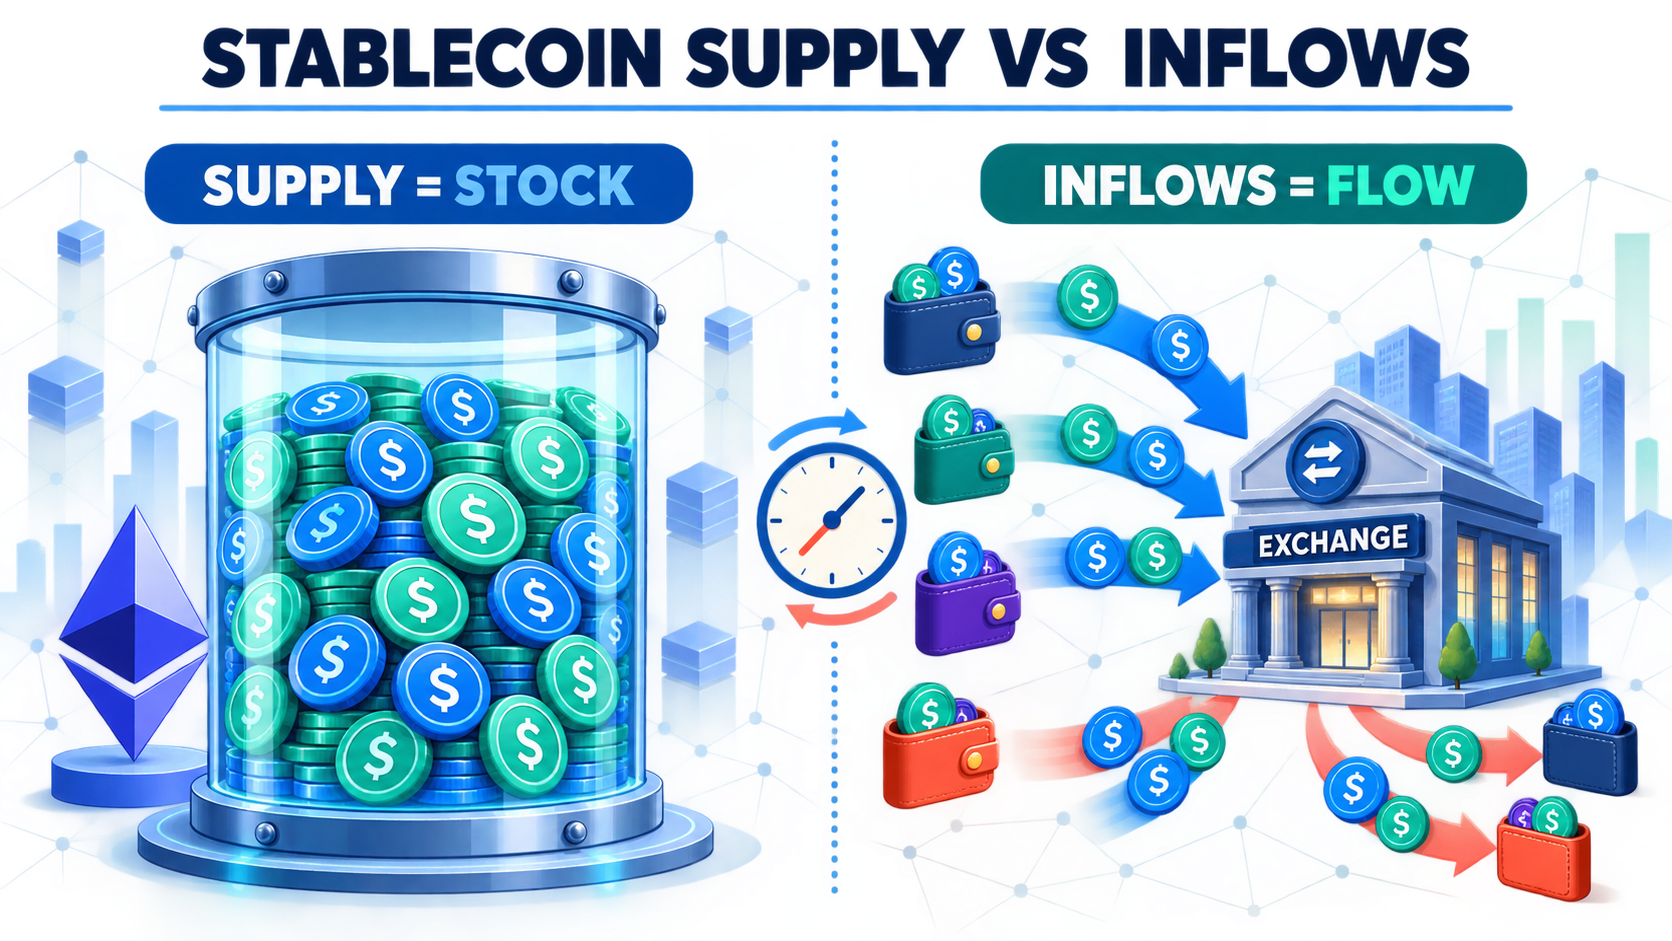
Stablecoin supply vs inflows is a comparison between a stock and a flow. Supply measures how much stablecoin value exists on a blockchain at a particular moment. Inflows measure how much value moved into a defined destination during a period.
The destination is the part that dashboards often leave implicit. “Stablecoin inflows” can refer to new issuance, assets bridged onto a chain, or deposits into centralized exchanges. Those are three different movements, and none should be treated automatically as another name for total supply growth.
This distinction matters because a blockchain can hold a large and rising stablecoin balance while exchanges receive little of it. The reverse is also possible: exchanges can record heavy deposits even when the total stablecoin supply on the chain is flat, because existing tokens are simply moving from wallets or applications into exchange-controlled addresses.
To make the difference concrete, this analysis uses Ethereum and a 30-day public supply series, followed by a controlled exchange-flow reconciliation. The result is simple: supply tells you how much exists; inflow tells you where some of it moved.
Stablecoin Supply vs Inflows: The Short Answer
Stablecoin supply is an end-of-period balance. Stablecoin inflow is activity during the period.
| Metric | Question It Answers | Basic Calculation | What It Does Not Prove |
|---|---|---|---|
| Stablecoin supply | How much stablecoin value exists on the chain now? | Outstanding tracked tokens × their USD value | Where the tokens are held or whether they are being used |
| Gross exchange inflow | How much stablecoin value entered labelled exchange wallets? | Sum of transfers into exchange-controlled addresses | How much left exchanges during the same period |
| Exchange netflow | Did exchange balances gain or lose stablecoins overall? | Exchange inflow − exchange outflow | Whether the funds will be used to buy crypto |
| Net supply change | Did outstanding supply expand or contract? | Ending supply − starting supply | Whether the change came from exchange activity |
A chain with $10 billion in stablecoin supply has a $10 billion stock at that measurement time. If $700 million enters exchanges and $650 million leaves during the day, gross exchange inflow is $700 million and netflow is only +$50 million. Neither number means the chain created $700 million or $50 million of new stablecoins.
Why “Stablecoin Inflow” Is Ambiguous
The word “inflow” describes a direction, not a complete metric. Before interpreting the number, identify the destination, the assets included, the time window and whether the figure is gross or net.
1. Issuance or net supply growth
At the issuer level, analysts often use “inflow” loosely to describe new stablecoins entering circulation. The cleaner term is net issuance: mints minus burns or redemptions. Positive net issuance expands outstanding supply; negative net issuance contracts it.
This is the movement most directly connected to total supply, but even here the chain matters. A multi-chain issuer can burn tokens on one network and mint the same amount on another. Global supply may remain unchanged while the distribution between chains changes materially.
2. Cross-chain or bridge inflow
A bridge inflow measures assets arriving on one blockchain from another. It can increase the supply available on the destination chain without increasing the stablecoin’s global supply. Some systems lock tokens on the source chain and issue a representation on the destination; others use burn-and-mint infrastructure.
This metric is useful when the question is whether stablecoin liquidity is migrating between ecosystems. It is not the same as exchange inflow, and it is not always equivalent to new issuer demand.
3. Exchange inflow
Exchange inflow measures stablecoins transferred into addresses identified as belonging to centralized exchanges. CryptoQuant defines stablecoin exchange inflow as the amount deposited into exchange wallets, while exchange outflow measures withdrawals. Netflow subtracts outflow from inflow.
Dune’s curated CEX-flow methodology applies the same directional logic to labelled addresses: transfers to an exchange are inflows, transfers from an exchange are outflows, and their signed difference is net flow. Coverage still depends on the address labels and token universe used by the provider.
In the rest of this article, “inflows” refers to exchange inflows unless another destination is stated explicitly.
Stablecoin Supply Is a Stock Metric
Token Terminal defines ecosystem stablecoin supply as the total value of outstanding stablecoins from all issuers on a chain. That definition describes a balance at a point in time.
A supply figure can change because tokens are minted or burned, moved between chains, or revalued when a tracked asset trades away from its reference price. The exact contribution of each mechanism depends on how the data provider constructs its series.
Supply alone does not reveal whether stablecoins sit on exchanges, inside lending protocols, in DEX pools, in treasury wallets or in inactive addresses. It measures availability, not deployment.
This is why the BlockCodex guide to stablecoin liquidity in a crypto ecosystem looks beyond the headline balance. A large supply becomes more economically useful when it is distributed across liquid markets, lending venues and payment activity rather than concentrated in a small number of idle wallets.
Stablecoin Inflow Is a Flow Metric
An inflow is measured over an interval: an hour, a day, a week or a month. It has a source and a destination. If those are missing from the chart title or methodology, the number is not ready for interpretation.
Gross exchange inflow counts all eligible stablecoin transfers into labelled exchange addresses during the window. A token can be counted in inflow even if it leaves the same exchange later that day. Gross outflow is calculated separately.
Netflow compresses both directions into one number:
Exchange netflow = gross exchange inflow − gross exchange outflow
If exchanges receive $1.2 billion and send out $1.1 billion, netflow is +$100 million. The gross movements total $2.3 billion, but the exchange balance increased by only $100 million, assuming the address coverage and valuation remain consistent.
The flow can be large while supply is unchanged because the same existing stablecoins are being redistributed. A transfer changes location; it does not automatically change the number of tokens outstanding.
A 30-Day Ethereum Check
To test how much information the supply balance preserves, I downloaded the public Ethereum stablecoin series from DefiLlama’s stablecoin endpoint and used the USD-valued circulating field for the 30 daily intervals from July 30 through August 29, 2026.
The calculation was rechecked on August 29, 2026. Aggregators can revise historical observations when adapters, token coverage or price data change, so the method and dates are provided for reproduction rather than presenting the last digit as permanent.
| Ethereum Supply Check | Result |
|---|---|
| Starting supply, July 30 | $148.636 billion |
| Ending supply, August 29 | $148.628 billion |
| Net 30-day change | −$8.0 million, approximately −0.005% |
| Days with a positive supply change | 15 |
| Days with a negative supply change | 15 |
| Sum of absolute daily changes | $7.173 billion |
| Largest daily increase | +$603.3 million on August 18 |
| Largest daily decrease | −$903.2 million on August 11 |
What the ending balance hides
If you compared only July 30 with August 29, Ethereum’s stablecoin supply would look almost perfectly flat. The net decline was roughly $8 million against a starting stock of about $148.6 billion.
The daily path was not flat. The sum of the absolute day-to-day changes was approximately $7.17 billion, with 15 increases and 15 decreases. Positive and negative movements largely offset one another before reaching the final balance.
This $7.17 billion figure is not an exchange-inflow total. It is a calculation from changes in the supply series, shown to demonstrate how much movement a start-to-end stock comparison can conceal. Treating it as capital deposited on exchanges would be incorrect.
Why the exchange-flow series will not reconcile automatically
A stablecoin can move from an Ethereum wallet into Binance, Coinbase or another labelled exchange without changing Ethereum’s total supply. The sender’s balance falls, the exchange address balance rises and the tokens remain on the same chain.
Conversely, Ethereum supply can increase because an issuer mints tokens or because assets arrive through cross-chain infrastructure, even if none of those tokens enters a centralized exchange during the same day.
Glassnode’s stablecoin exchange-netflow chart explicitly limits its metric to selected stablecoins issued and transferred on Ethereum and to exchanges covered by its labelling system. Its own transparency notice warns that exchange balances depend on known addresses and clustering. A DeFiLlama chain-supply series and a Glassnode or CryptoQuant exchange-flow series therefore do not have identical asset coverage, address coverage or measurement boundaries.
The correct conclusion is not that one provider is wrong. The metrics answer different questions.
A Controlled Reconciliation
The following example uses one chain and one day inside a 30-day observation process. The numbers are illustrative, not Ethereum network statistics.
| Event | Effect on Chain Supply | Effect on Exchange Inflow |
|---|---|---|
| An issuer mints $250 million on Ethereum | +$250 million | $0 unless the tokens enter an exchange wallet |
| Users redeem and burn $120 million | −$120 million | $0 unless an exchange address is part of the path |
| Existing holders deposit $900 million to exchanges | $0 | +$900 million gross inflow |
| Exchanges send $850 million to external wallets | $0 | +$850 million gross outflow |
Ending supply rises by $130 million because $250 million was minted and $120 million was burned. Gross exchange inflow is $900 million. Exchange netflow is only +$50 million because $850 million left exchanges.
All three figures are valid:
- Supply change: +$130 million
- Gross exchange inflow: $900 million
- Exchange netflow: +$50 million
They differ because they describe different events. The mint and burn alter the number of outstanding tokens. Exchange transfers redistribute tokens that already exist.
How Supply and Inflows Can Move in Different Directions
| Supply | Exchange Netflow | Plausible Explanation | What to Check Next |
|---|---|---|---|
| Rising | Positive | Supply is expanding while part of the stablecoin balance moves to exchanges | Issuer-level mints, exchange distribution and spot liquidity |
| Rising | Negative | New supply exists, but exchange withdrawals exceed deposits | DeFi deposits, treasury wallets, bridges and custody movements |
| Flat | Positive | Existing stablecoins are being moved from external wallets to exchanges | Gross inflow, gross outflow and whether one venue dominates |
| Flat | Negative | Stablecoins are leaving exchanges but remaining on the chain | Self-custody, lending, DEX pools and cross-chain destinations |
| Falling | Positive | Supply contracts while remaining tokens concentrate on exchanges | Burns, redemptions and exchange balance share |
| Falling | Negative | Supply is contracting and stablecoins are also leaving exchanges | Issuer redemptions, bridges and broader liquidity conditions |
None of these combinations is automatically bullish or bearish. Stablecoins deposited on an exchange may be used to buy risk assets, post derivatives collateral, support market-making, rebalance custody or settle institutional transfers.
The BlockCodex guide on how to read exchange netflow explains why direction alone is not enough. A net inflow compresses many possible motives into one balance change.
Five Common Interpretation Errors
Calling every supply increase an inflow
A dashboard may label a positive 30-day supply change as “inflow,” especially when comparing chains. That shorthand can be useful, but it should not be confused with transfers into exchange wallets. Check the methodology before reusing the label.
Comparing a stock with a daily flow
A $150 billion supply balance and a $500 million daily inflow do not form a meaningful ratio without a clear question. One is the amount outstanding; the other is movement during one day. If you want exchange turnover, compare a consistent flow measure with exchange balances over the same coverage and period.
Using gross inflow as netflow
Large deposits can coexist with equally large withdrawals. Gross inflow measures one direction. Netflow measures the difference. Reporting $2 billion of inflows without mentioning $1.9 billion of outflows creates a very different impression from the actual +$100 million net change.
Ignoring provider coverage
Exchange metrics require address labels. Providers can monitor different exchanges, tokens and deposit-address clusters. Chain-supply aggregators can also differ in token inclusion and price treatment. The same label does not guarantee the same universe.
Assuming exchange inflow means immediate buying
Stablecoins on exchanges represent potential trading liquidity, not a confirmed order. Funds can remain idle, support derivatives positions, move between internal wallets or leave again without buying a volatile asset.
A Practical Reading Workflow
Use the following sequence whenever a dashboard claims stablecoin inflows are rising:
- Name the destination. Is the metric measuring issuance, bridge arrivals, exchange deposits or protocol deposits?
- Check whether it is gross or net. If it is netflow, retrieve inflow and outflow separately when possible.
- Match the time window. Do not compare a daily flow directly with a month-end stock change.
- Match the asset universe. Confirm which stablecoins and chains are included.
- Inspect the level and the change. A large absolute supply can remain stagnant, while a small ecosystem can post a high percentage increase from a low base.
- Look for the destination of retained liquidity. Check exchange balances, DEX depth, lending deposits and bridge flows.
- Confirm with another metric. Trading volume, active addresses, fees and user retention help show whether stablecoins are supporting real activity.
This keeps the analysis focused on capital movement rather than forcing every stablecoin chart into a single market narrative.
What Each Metric Is Best Used For
Use stablecoin supply when you want to compare the dollar-like capital base of a chain through time. It is useful for ecosystem analysis, but it should be paired with liquidity depth and usage.
Use gross exchange inflow when you want to measure the intensity of deposits into trading venues. Pair it with outflow, exchange balance and venue concentration.
Use exchange netflow when you want the directional change in labelled exchange holdings. Pair it with the gross legs because a small net number can hide heavy two-way movement.
Use bridge netflow when the question is whether liquidity is migrating between chains. Pair it with issuer-level supply data so a cross-chain relocation is not mistaken for global stablecoin creation.
For the broader role of stablecoins beyond this metric comparison, see Stablecoins as an Ecosystem Growth Layer. That article covers why stablecoins matter; this one is deliberately narrower and explains how to read two commonly confused measurements.
Conclusion
Stablecoin supply and stablecoin inflows are connected, but they are not interchangeable.
Supply is a stock: the value outstanding on a chain at a measurement time. Inflow is a flow: value moving into a defined destination during an interval. Exchange inflows can surge without changing total chain supply because existing tokens are being redistributed. Supply can expand without equivalent exchange inflows because newly issued or newly bridged tokens may remain elsewhere.
The Ethereum check shows why the distinction matters. A start-to-end comparison looked almost flat over 30 days, yet the daily supply series contained billions of dollars in offsetting changes. Adding exchange data introduces another boundary—labelled destinations—rather than a substitute for the supply chart.
Before interpreting any stablecoin “inflow,” ask one question: inflow into what?
Frequently Asked Questions
Does higher stablecoin supply mean capital is entering crypto?
It can indicate net issuance or growth in the tracked USD value, but it does not show where the stablecoins are held or how they will be used. Check issuer-level mints and burns, chain distribution and market activity before drawing a broader conclusion.
Are stablecoin inflows bullish for Bitcoin?
Not automatically. Exchange deposits can increase potential buying power, but they can also support derivatives collateral, market-making, custody operations or internal rebalancing. The interpretation needs trading, price and exchange-specific context.
What is the difference between stablecoin inflow and netflow?
Inflow counts transfers into the destination. Netflow subtracts outflows from inflows. Positive netflow means more entered than left during the selected period; negative netflow means withdrawals were larger.
Can stablecoin supply rise while exchange netflow is negative?
Yes. New or bridged supply can remain in wallets, DeFi protocols or payment applications while exchanges experience net withdrawals. The two metrics track different balance boundaries.
Which source should I use for stablecoin supply?
Use a provider with transparent chain and token coverage, then keep the source consistent through the comparison. DefiLlama and Token Terminal publish chain-level stablecoin supply views. For exchange flows, use a provider that documents its address-labelling methodology and coverage limitations.