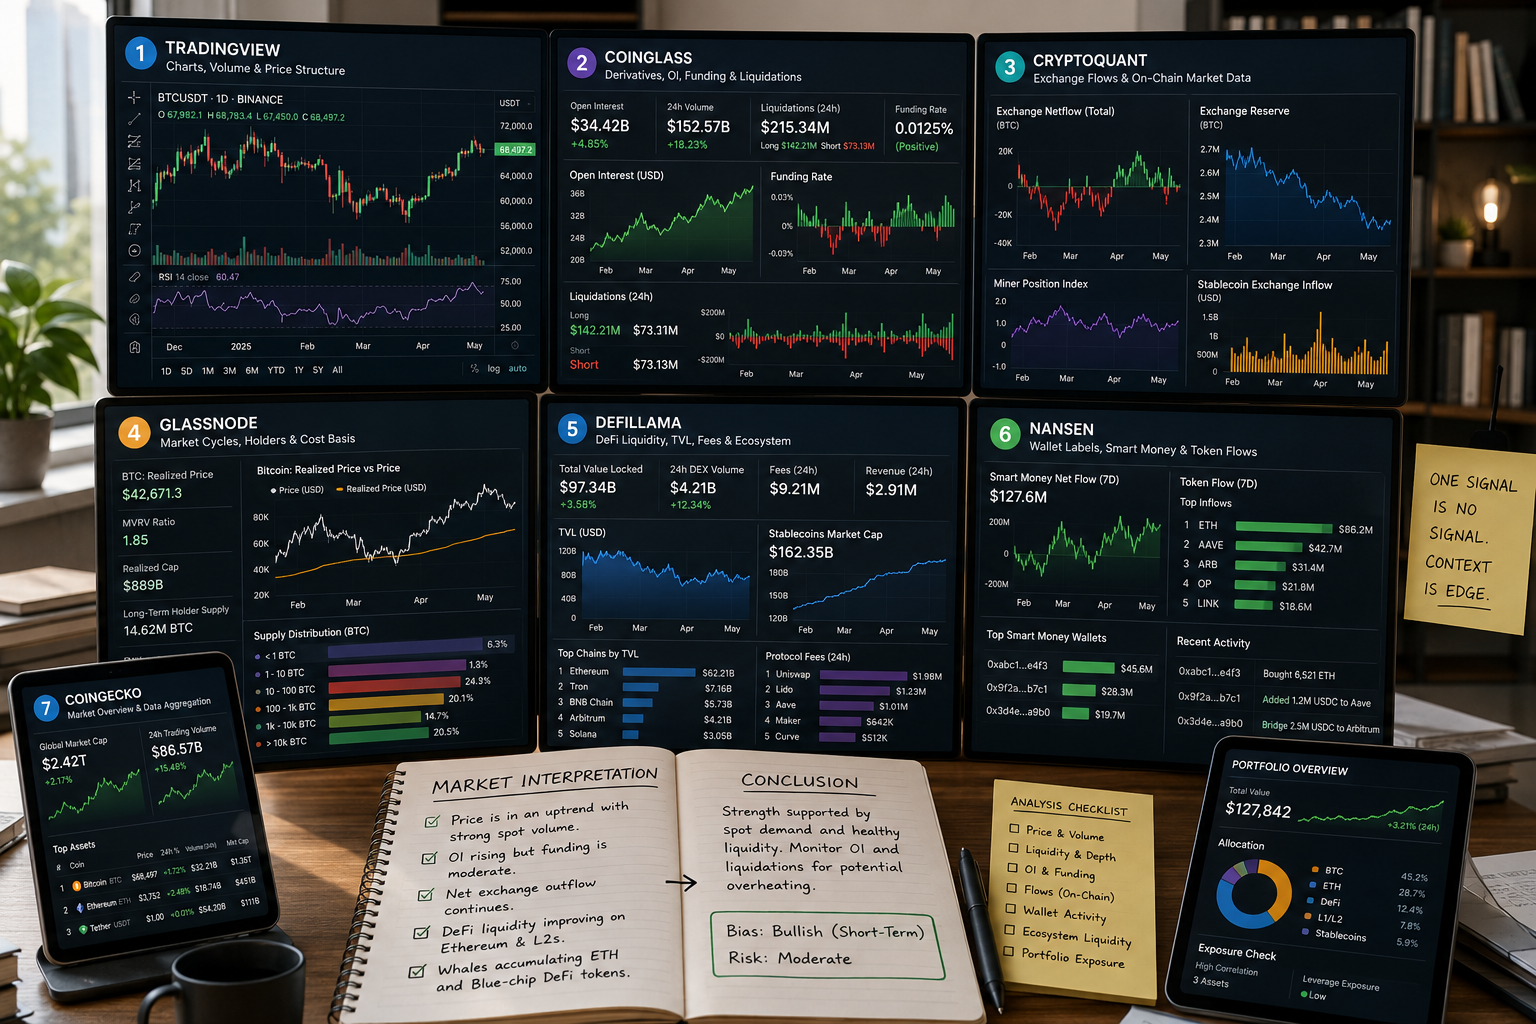
The best crypto market analysis tools do not simply show more data. They help investors separate different types of market activity that can look identical on a price chart.
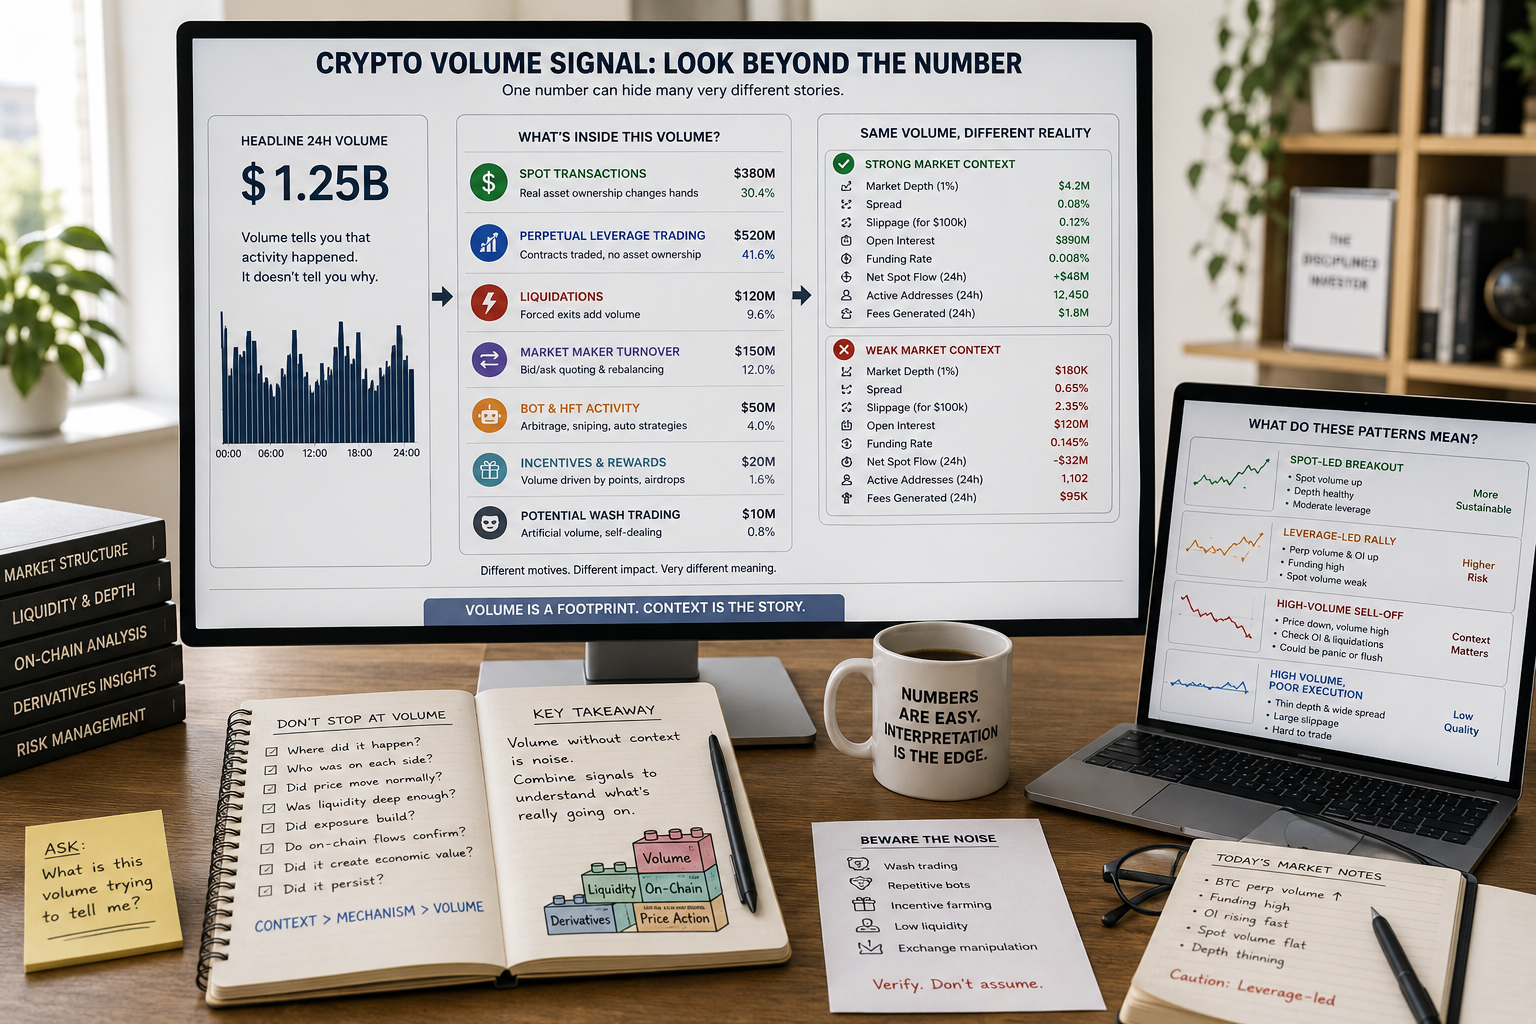
A token can rise because spot buyers are accumulating it, leveraged traders are chasing momentum, liquidity has suddenly become thinner, or short positions are being liquidated. All four situations can produce a green candle and higher volume, but they do not carry the same risk.
No single dashboard can explain the entire move.
Charting platforms show price structure and executed volume. Derivatives platforms reveal leverage, funding and liquidations. On-chain tools help track exchange balances and wallet behavior, while DeFi platforms expose liquidity, stablecoin supply and protocol activity.
The strongest setup is therefore not the one with the most subscriptions. It is the one where every tool answers a different question.
A useful research stack should help determine:
- What actually traded?
- Was the move driven by spot or derivatives?
- Can the market absorb a realistic position?
- Is leverage increasing or being removed?
- Are assets moving toward exchanges or away from them?
- Is liquidity entering an ecosystem?
- Are large wallets accumulating, distributing or simply reorganizing funds?
- Does the market signal matter for the investor’s own portfolio?
This guide compares seven crypto market analysis tools based on the job each one performs, where it adds genuine value and where investors still need another layer of evidence.
Table of Contents
The Three Questions Every Market Analysis Stack Must Answer
Before comparing tools, it helps to separate market analysis into three practical questions.
What Is Trading?
Price charts, spot volume, perpetual volume, open interest and liquidations show how active a market is and what kind of exposure traders are creating.
Can the Market Absorb the Trade?
Order-book depth, spreads, pool liquidity and estimated slippage reveal whether the displayed price is realistically available for the intended position size.
Where Is Capital Moving?
Exchange flows, stablecoin movements, wallet activity, protocol deposits and ecosystem inflows help show how capital is being repositioned.
These questions overlap, but they are not interchangeable. A platform that excels at derivatives data may provide little insight into DeFi liquidity. An on-chain dashboard may identify an exchange inflow without showing whether the market has enough depth to absorb it.
That is why each tool in the stack needs a clear role.
Crypto Market Analysis Tools Compared
| Tool | Best Use | Cost Profile | Main Blind Spot |
|---|---|---|---|
| TradingView | Charts, volume profiles, alerts and price structure | Freemium | Limited on-chain interpretation |
| CoinGlass | Open interest, funding, liquidations and derivatives | Freemium | Derivatives activity is not net direction |
| CryptoQuant | Exchange flows and on-chain market behavior | Freemium to professional | Flows still require context |
| Glassnode | Market cycles, holder cohorts and cost basis | Premium | Less focused on immediate execution |
| DeFiLlama | DeFi liquidity, stablecoins, fees and ecosystem activity | Mostly free, Pro available | TVL does not equal executable depth |
| Nansen | Wallet labels, entity flows and Smart Money activity | Premium | Labels are not automatic trade signals |
| CoinGecko | Market coverage, prices, volumes and cross-venue context | Free, paid API available | Aggregated figures can hide venue quality |
The best tool depends on the uncertainty being investigated.
1. TradingView: Best for Price Structure, Volume Profiles and Cross-Market Comparison
TradingView is the visual layer of the research stack.
It is useful for examining price structure, comparing spot and perpetual markets, applying volume profiles, setting alerts and reviewing the same asset across different exchanges. Its current paid tiers expand the number of charts, indicators, historical bars and alerts available, while features such as Volume Profile help show where trading activity has concentrated across price levels.
TradingView is particularly useful for investigating:
- Breakouts and failed breakouts.
- Spot versus perpetual price behavior.
- Volume around important levels.
- Support and resistance zones.
- Relative performance between assets.
- Market reactions to news or liquidations.
- Differences between exchange pairs.
- Changes in volatility and trend structure.
Its greatest strength is flexibility. An investor can compare a BTC spot pair, a perpetual contract, total crypto market capitalization and stablecoin dominance without moving between several disconnected interfaces.
That does not mean the chart explains the cause of a move.
A volume spike may come from spot demand, liquidations, arbitrage or leverage. TradingView makes the event visible, but the investor still needs derivatives and on-chain tools to understand its origin.
When TradingView Is Worth Paying For
The free version is sufficient for basic chart review. A paid plan becomes more useful when the investor regularly needs:
- Multiple charts on one screen.
- More simultaneous indicators.
- Volume Profile.
- Longer historical datasets.
- More price and technical alerts.
- Several saved layouts.
- A cleaner ad-free research environment.
The subscription is easier to justify when charting is part of a repeated weekly process rather than occasional price checking.
TradingView should be the visual control room of the stack, not the only source of evidence.
2. CoinGlass: Best for Leverage, Funding and Liquidation Risk
CoinGlass is designed around the derivatives layer of the crypto market.
Its dashboards combine perpetual and futures volume, open interest, funding rates, long-to-short positioning, liquidations, options data and liquidity or order-depth information across exchanges. Its asset pages also place volume, open interest, liquidations and liquidity near one another, making it easier to see whether leverage is building faster than the market can absorb.
CoinGlass is useful when an investor wants to know:
- Is open interest increasing with price?
- Are long or short positions becoming crowded?
- Is funding moving toward an extreme?
- Did a volume spike come from liquidations?
- Which exchanges hold the most derivatives exposure?
- Is leverage expanding or being flushed from the market?
- How much liquidity sits near important liquidation zones?
The platform becomes especially valuable during rapid price moves.
Suppose BTC rises while perpetual volume, open interest and positive funding all accelerate, but spot activity remains moderate. TradingView may show a strong breakout, while CoinGlass reveals that leveraged traders are carrying a growing share of the move.
The price can continue rising, but the structure is more fragile than a spot-led advance.
What CoinGlass Cannot Tell You Alone
High perpetual volume is not automatically bullish or bearish. Every contract has two sides, and volume can increase because positions are opened, closed, reversed, hedged or liquidated.
Open interest, funding and spot behavior must be read together.
For a deeper interpretation framework, see Spot Volume vs Perpetual Volume in Crypto.
CoinGlass is the leverage monitor of the stack. It is not a substitute for spot demand, market depth or on-chain flows.
3. CryptoQuant: Best for Exchange Flows and Market-Relevant On-Chain Data
CryptoQuant connects blockchain activity with market behavior.
Its platform covers on-chain and market data, while its exchange-flow metrics track assets moving into and out of identified exchange wallets. CryptoQuant also supports dashboards, alerts and API access for workflows that require repeated monitoring or data integration.
The platform is particularly useful for tracking:
- Exchange inflows.
- Exchange outflows.
- Exchange netflows.
- Exchange reserves.
- Stablecoin flows.
- Miner behavior.
- Whale-related activity.
- Derivatives metrics.
- Market indicators combining price and on-chain data.
CryptoQuant adds a layer that charts cannot provide.
A large BTC deposit to an exchange may increase potential sell-side supply. A sustained decline in exchange reserves may suggest that more coins are being held outside immediate trading venues. Stablecoin deposits can indicate available trading liquidity or collateral preparation.
None of these interpretations is automatic.
An exchange inflow can relate to selling, collateral management, custody, market making or internal exchange operations. The value of CryptoQuant comes from observing patterns across time rather than treating one transfer as a direct prediction.
When CryptoQuant Adds the Most Value
CryptoQuant is strongest when the research question concerns centralized exchange behavior.
It can help distinguish between:
- A rally supported by exchange outflows.
- A price decline accompanied by heavy deposits.
- A leverage flush without broad spot distribution.
- Stablecoin liquidity preparing to enter the market.
- Large flow events that deserve transaction-level investigation.
BlockCodex’s guide on Exchange Inflow in Crypto explains how these metrics should be combined with price reaction, wallet type, netflows and liquidity.
CryptoQuant is the exchange-flow layer of the stack. It shows where assets are moving, but not necessarily what their owners will do next.
4. Glassnode: Best for Holder Behavior, Cost Basis and Market Cycles
Glassnode is most useful when the investor wants to move beyond short-term activity and study the structure of ownership.
The platform combines spot, derivatives and on-chain data with metrics covering realized value, cost basis, profitability, supply distribution and holder cohorts. Glassnode currently advertises more than 1,700 metrics across its broader platform, while its personal Studio plan provides hundreds of metrics at daily resolution for charting and research.
Glassnode can help analyze:
- Realized capitalization.
- Realized price.
- MVRV.
- SOPR.
- Profit and loss realization.
- Long-term and short-term holder behavior.
- Cost-basis distributions.
- Supply held by different cohorts.
- Exchange balances.
- Market-cycle conditions.
These metrics are valuable because market price alone does not reveal where investors acquired their coins or whether holders are sitting on substantial unrealized profit.
For example, a market approaching a major cost-basis cluster may encounter different behavior from one trading through an area where little supply previously changed hands. Similarly, heavy profit realization does not always signal a final top, but it can show that earlier holders are transferring inventory to newer participants.
Who Needs Glassnode?
Glassnode is better suited to investors and researchers who regularly study Bitcoin, Ethereum and broader market cycles. It may be excessive for someone who only wants occasional exchange-flow checks or basic price charts.
Its value increases when the user:
- Publishes research.
- Tracks cycle indicators over time.
- Compares holder cohorts.
- Builds repeatable macro dashboards.
- Needs standardized historical on-chain data.
- Wants to distinguish short-term trading noise from ownership changes.
Glassnode is the structural memory of the stack. It helps explain how the current market developed, rather than only what happened during the last hour.
5. DeFiLlama: Best for DeFi Liquidity, Stablecoins and Ecosystem Flows
DeFiLlama is one of the strongest free starting points for DeFi market analysis.
Its dashboards cover TVL, stablecoin supply, DEX volume, perpetual volume, protocol fees, revenue, yields, open interest and ecosystem-level inflows. Chain pages place many of these metrics together, allowing investors to examine whether liquidity, usage and economic activity are moving in the same direction.
DeFiLlama is useful for comparing:
- Chain TVL.
- Protocol TVL.
- Stablecoin supply by ecosystem.
- DEX trading volume.
- Perpetual DEX volume.
- Fees and protocol revenue.
- Capital inflows.
- Yield pools.
- Open interest on decentralized venues.
- Liquidity distribution across chains.
Its greatest advantage is breadth.
An investor researching an ecosystem can see whether stablecoins are entering, whether DEX activity is rising, which protocols hold most of the capital and whether fees are improving alongside TVL.
Why TVL Is Not Enough
A protocol can report high TVL while offering poor execution for a specific trade. Capital may be concentrated in assets unrelated to the intended pair, deposited outside the active price range or supported by temporary incentives.
DeFiLlama maps the ecosystem. The investor still needs to examine:
- Pool depth.
- Expected slippage.
- Token concentration.
- Withdrawal conditions.
- Bridge dependency.
- Liquidity persistence.
- The quality of fees and revenue.
For that reason, DeFiLlama works particularly well alongside What Is Market Depth in Crypto? and the BlockCodex liquidity cluster.
DeFiLlama is the DeFi capital map of the stack. It reveals where liquidity is located, but not whether every dollar is immediately executable.
6. Nansen: Best for Wallet Labels, Entity Flows and Smart Money Context
Nansen adds identity and behavioral context to public blockchain activity.
A blockchain explorer can show that assets moved from one address to another. Nansen attempts to make that activity more understandable through wallet labels, entity analysis, Smart Money tracking, token flows, DeFi positions and custom alerts. The platform positions itself around wallet-flow analysis and currently references a labeling system covering hundreds of millions of addresses.
Nansen can help investigate:
- Which labeled wallets are accumulating a token.
- Whether funds or whales are rotating into an ecosystem.
- Where stablecoins are moving.
- Which protocols are attracting notable wallets.
- How individual wallets are positioned.
- Whether capital is moving between sectors.
- Which addresses entered or exited early.
- How token-holder composition is changing.
The main benefit is speed.
Manually investigating a wallet through several blockchain explorers can take time, especially across chains. Labels and entity groupings help narrow the investigation and identify activity that deserves closer review.
The Smart Money Trap
A Smart Money label should never replace an investment thesis.
A profitable wallet may be hedged elsewhere, providing liquidity, executing on behalf of another entity or operating with a different time horizon. Even a correctly identified fund can make a poor trade.
Nansen should answer:
Who may be behind the flow, and how does that change the context?
It should not answer:
Should I copy the transaction?
Nansen is the behavioral layer of the stack. It adds identity to flows without turning those flows into guaranteed signals.
7. CoinGecko: Best for Broad Market Coverage and a Reliable Baseline
CoinGecko is the orientation tool.
It helps investors establish the basic market context before moving into specialized analytics. Its platform covers prices, market capitalization, supply, trading volume, exchanges, categories and on-chain DEX data, while its API documentation currently lists extensive coverage across centralized exchanges, blockchain networks, DEXs and tokens.
CoinGecko is useful for:
- Checking market capitalization and supply.
- Comparing spot prices across venues.
- Reviewing exchange volume.
- Identifying the main trading pairs.
- Exploring token categories.
- Comparing ecosystem assets.
- Tracking watchlists and portfolios.
- Establishing a cross-market reference price.
- Accessing market data through an API.
Its role is simple but important.
Before interpreting exchange flows, leverage or wallet activity, investors need to confirm which asset they are analyzing, where it trades, how large it is and whether the market is concentrated on one or two venues.
The Limitation of Aggregated Data
Aggregate volume can make a market look healthier than the venue available to the investor.
A token may trade across several exchanges, but most activity could be concentrated on one platform. Some venues may have shallow order books, unusual pricing or low-quality volume.
CoinGecko provides the map. Investors should still inspect the specific road they intend to use.
For suspicious activity, compare its figures with the methods in How to Identify Fake Volume in Crypto.
CoinGecko is the baseline of the stack. It helps establish the market universe before specialized tools explain its internal structure.
Which Crypto Market Analysis Tools Work Best Together?
The strongest combination depends on the question.
| Research Question | Primary Tools | What the Combination Reveals |
|---|---|---|
| Is a breakout spot-led or leverage-led? | TradingView + CoinGlass | Price structure, volume, open interest, funding and liquidations |
| Are investors moving coins toward exchanges? | CryptoQuant + TradingView | Exchange flows and the market’s price response |
| Is a blockchain ecosystem genuinely growing? | DeFiLlama + Nansen + CoinGecko | Liquidity, stablecoins, protocol activity, wallet behavior and market context |
| Where are we in the Bitcoin cycle? | Glassnode + CryptoQuant + TradingView | Holder cost basis, profitability, exchange flows and price structure |
| Is small-cap volume credible? | CoinGecko + TradingView + DeFiLlama | Venue concentration, depth, DEX activity and execution quality |
| Are whales rotating into a sector? | Nansen + CoinGecko + DeFiLlama | Wallet flows, token performance and ecosystem liquidity |
| Is a liquidation event a reset or broader distribution? | CoinGlass + CryptoQuant + TradingView | Deleveraging, spot flows and price absorption |
The objective is not to open every platform for every decision.
The research question should determine which tools enter the workflow.
A Free Crypto Market Analysis Stack
Many investors can build a useful setup without immediately paying for several subscriptions.
A practical free stack can include:
CoinGecko for Orientation
Use it to identify the asset, market capitalization, supply, major venues and baseline volume.
TradingView for Price Structure
Use the free charting layer for price, volume and basic cross-market comparison.
CoinGlass for Derivatives Context
Review public funding, open-interest and liquidation dashboards.
DeFiLlama for DeFi Liquidity
Use chain and protocol pages to compare TVL, stablecoins, DEX volume, fees and revenue.
Blockchain Explorers for Verification
Return to the underlying transaction whenever a wallet alert or flow requires confirmation.
This stack is sufficient for many beginners and intermediate investors. The limitation is that research remains more manual, alerting is restricted and advanced historical or labeled-wallet data may be unavailable.
When a Paid Tool Becomes Worth It
A paid crypto analytics subscription should solve a specific bottleneck.
TradingView may be worth paying for when more charts, alerts and volume-profile tools improve a repeated charting workflow. Glassnode becomes more useful when the investor needs standardized cycle and cohort data. Nansen adds value when wallet identification consumes too much time, while CryptoQuant’s advanced features suit users who monitor exchange flows and on-chain indicators regularly.
The wrong reason to subscribe is that the platform looks professional.
The stronger reasons are:
- It replaces several hours of manual research.
- It provides data unavailable elsewhere.
- It improves monitoring of a meaningful portfolio.
- It reduces the chance of missing a material risk.
- It supports research, reporting or content production.
- It makes the same analytical process easier to repeat.
Paid platforms should earn their place in the workflow.
Do Not Pay for Three Tools That Perform the Same Job
Tool overlap is one of the easiest ways to waste money.
Several platforms may offer prices, exchange flows, open interest or market dashboards. That does not mean investors need every version of the same metric.
A more efficient stack assigns one primary tool to each layer:
| Research Layer | Primary Tool Example |
|---|---|
| Charts and price structure | TradingView |
| Derivatives and liquidations | CoinGlass |
| Exchange flows | CryptoQuant |
| Holder cohorts and cycles | Glassnode |
| DeFi capital and liquidity | DeFiLlama |
| Wallet identity and entities | Nansen |
| Broad market baseline | CoinGecko |
Choose one paid product where the workflow needs more depth, then use complementary free tools for the remaining layers.
A seven-tool article should not become a seven-subscription recommendation.
Connecting Market Analysis to Portfolio Exposure
Market data remains abstract until it is connected to an actual position.
A derivatives dashboard may show rising liquidation risk, but the consequence depends on whether the investor owns the asset, holds leveraged positions or has no exposure at all. DeFiLlama may reveal declining ecosystem liquidity, but that matters more when the portfolio contains several protocols dependent on the same chain.
A portfolio tracking system should answer:
- Which assets are exposed to the signal?
- How much capital is at risk?
- Are several positions dependent on the same ecosystem?
- Is liquidity sufficient for the total exit size?
- Would one market event affect several holdings at once?
- Which positions require closer monitoring?
BlockCodex’s guide on Best Crypto Portfolio Tracking Setups explains how to connect wallet data, exchange balances, DeFi positions and research notes into one exposure map.
Market tools explain the environment.
Portfolio tracking explains what that environment means for you.
A Practical Crypto Market Analysis Workflow
A disciplined workflow can remain simple even when several tools are available.
Begin With the Decision
Define what you are trying to determine. A question such as “Is this token bullish?” is too vague. A stronger question might be:
Is the current breakout supported by spot demand and sufficient liquidity, or is it being driven mainly by leveraged perpetual traders?
That question immediately narrows the required tools.
Build the Market Baseline
Use CoinGecko and TradingView to verify the asset, relevant venues, trading pairs, price structure and headline volume.
Examine Execution Quality
Review market depth, spreads, pool liquidity and estimated slippage. A bullish thesis is less useful if the position cannot be entered or exited efficiently.
Add Leverage and Flow Context
CoinGlass can show whether open interest, funding and liquidations are shaping the move. CryptoQuant or Nansen can then reveal whether exchange and wallet flows support the interpretation.
Check the Broader Structure
Use Glassnode for holder and cycle context or DeFiLlama for ecosystem liquidity and protocol economics, depending on the asset being researched.
Connect the Signal to the Portfolio
Finish by deciding whether the evidence changes position size, risk limits, monitoring conditions or the original thesis.
The outcome should be a written conclusion rather than a collection of screenshots.
For example:
The breakout is supported by improving spot volume and stable market depth, while perpetual open interest is increasing without extreme funding. Exchange outflows provide additional confirmation, but the position will remain limited because liquidity weakens significantly beyond a 1.5% move.
That conclusion combines several tools without allowing any one dashboard to dictate the decision.
Common Mistakes When Using Crypto Market Analysis Tools
Opening the Tool Before Defining the Question
Without a question, the investor usually follows whichever chart appears most dramatic.
Treating Every Dashboard as Independent Confirmation
Several platforms may use the same exchange data or similar methodologies. Repetition is not always independent evidence.
Confusing Visibility With Understanding
A clean chart can accurately display a metric while the investor still misunderstands what it represents.
Paying for Complexity Too Early
Beginners often benefit more from learning market depth, volume, funding and flows than from adding another premium dashboard.
Ignoring Methodology
Metrics with similar names can use different exchange sets, entity labels, time zones or filtering rules.
Treating Wallet Labels as Predictions
Labels add context. They do not guarantee the intention or future success of the wallet owner.
Forgetting the Portfolio
A market signal only becomes actionable when its relationship to position size, liquidity and risk is understood.
Final Thoughts
The best crypto market analysis tools do not compete to provide one perfect answer.
They observe different parts of the same market.
TradingView shows the visible price structure. CoinGlass reveals leverage and liquidation pressure. CryptoQuant tracks exchange-related flows. Glassnode places the market inside a longer holder and cycle context. DeFiLlama maps DeFi liquidity and protocol economics, while Nansen adds wallet identity and CoinGecko establishes the broader market baseline.
The value comes from connecting these layers without confusing them.
Volume shows that activity occurred. Market depth shows whether the activity can be absorbed. Open interest and funding reveal how much leverage is involved. Exchange and wallet flows help identify where capital is moving, while portfolio tracking determines whether any of those signals materially affect the investor.
Most people do not need every tool in this article.
They need one clear tool for each question they regularly ask, one paid platform where deeper access genuinely improves the workflow, and enough discipline to verify important conclusions through a second independent layer.
A useful analytics stack should reduce uncertainty.
It should not create a larger collection of charts to misunderstand.