Trading volume feels reassuring because it is easy to understand.
A token traded $500 million today instead of $100 million yesterday. Activity increased, so something important must be happening. If the price is also rising, the volume is often presented as confirmation that demand is real.
Sometimes that interpretation is correct.
Just as often, the number conceals more than it reveals.
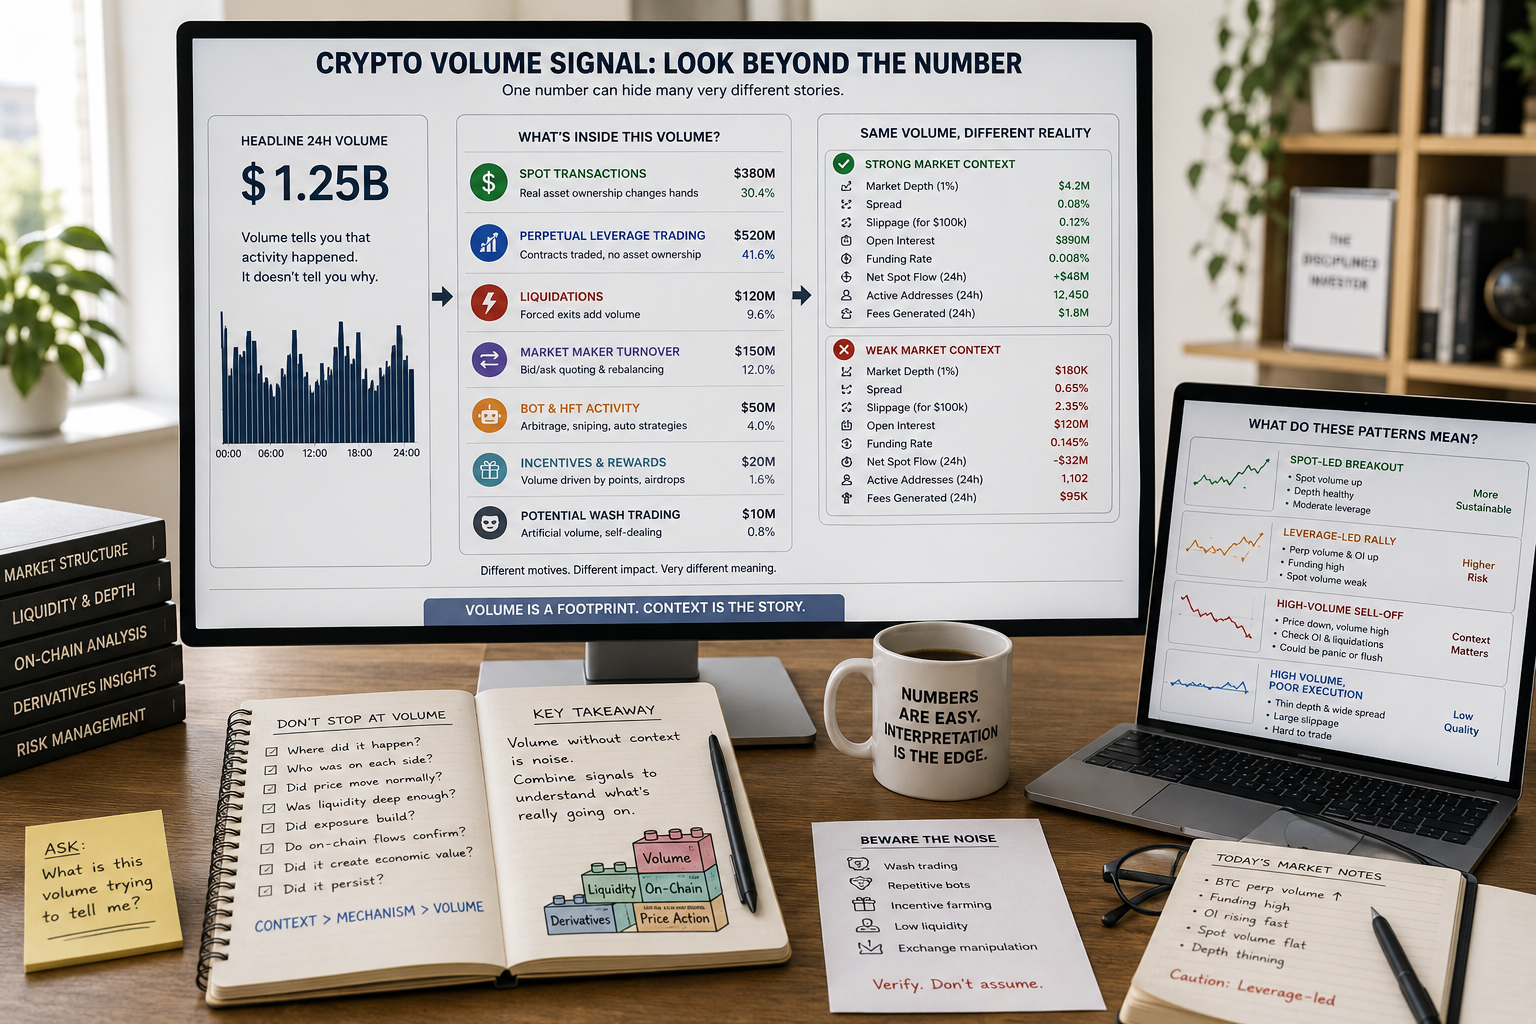
Volume records how much trading occurred during a period. It does not explain who initiated the activity, whether positions were opened or closed, whether the same capital traded repeatedly, whether orders could be executed without heavy slippage, or whether the activity came from investors, market makers, bots, liquidations, incentives, or wash trading.
That makes the crypto volume signal useful as evidence but weak as a conclusion.
A better way to think about volume is as a footprint. It proves that activity occurred, but it does not identify who created the footprint, where they were going, or why they moved.
The analytical work begins after the number appears.
Table of Contents
What the Crypto Volume Signal Actually Measures
Trading volume measures completed transactions over a defined period.
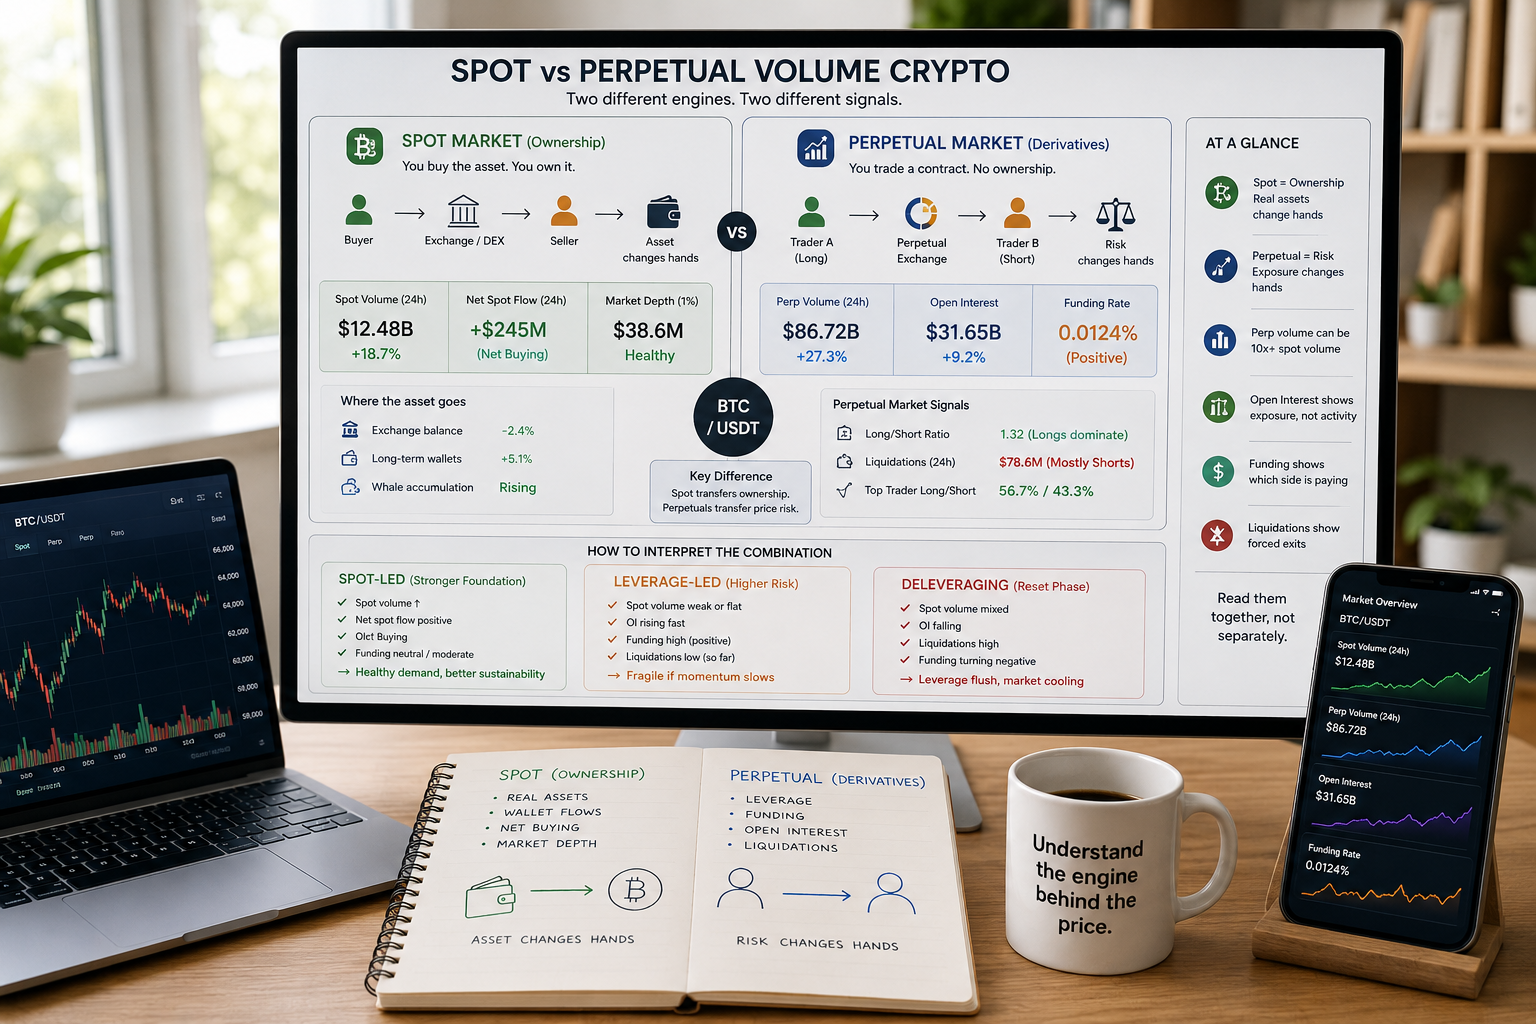
On a spot exchange, it reflects the value or quantity of assets exchanged between buyers and sellers. In perpetual markets, it reflects the notional value of derivative contracts traded. On a decentralized exchange, it records swaps routed through liquidity pools or on-chain order books.
Those activities are economically different, yet dashboards often place them under the same broad label: volume.
That compression creates the first problem.
A $1 million spot purchase transfers ownership of the underlying asset. A $1 million perpetual trade transfers price exposure without necessarily moving the asset. A market maker buying and selling repeatedly can generate substantial turnover while keeping relatively little directional exposure. A liquidation can create high volume even though the trader did not choose to exit voluntarily.
The total captures movement.
It does not capture motive.
This is why BlockCodex’s guide to spot versus perpetual volume separates asset turnover from leveraged risk transfer. Coinbase’s 2026 market guide similarly notes that perpetual futures remain the largest venue for global crypto trading activity by a wide margin, making the composition of volume essential to its interpretation.
Volume Is an Odometer, Not a Compass
An odometer tells a driver how much distance a vehicle has covered. It does not say whether the vehicle travelled north, south, in circles, or back to where it started.
Volume has the same limitation.
High turnover can accompany accumulation, distribution, panic, arbitrage, manipulation, market making, or simple position recycling. Two markets can report the same volume while producing completely different outcomes for investors.
Consider two simplified examples:
| Market | Daily Volume | Market Depth Within 1% | Price Response | Likely Interpretation |
|---|---|---|---|---|
| Market A | $50 million | $4 million | Stable execution | Broad, usable liquidity |
| Market B | $50 million | $120,000 | Large impact from moderate orders | High turnover but fragile liquidity |
The headline activity is identical. The ability to enter or exit is not.
Kaiko’s liquidity research treats volume, spreads, market depth, and slippage as separate indicators because no single one captures market quality. Market depth measures available bids and asks around the price, while volume describes transactions that have already happened.
This distinction is the foundation of volume analysis.
Volume tells you that the road was busy. Depth tells you whether the road can handle your vehicle.
1. Every Unit of Volume Contains Both a Buyer and a Seller
Investors often describe rising volume as “more buying.”
That language is incomplete.
Every completed transaction includes both sides. If one trader buys 10 ETH, another participant sells 10 ETH. Volume increases regardless of which participant is more informed, more urgent, or more committed.
Price can provide additional context because it shows which side had to become more aggressive to complete the trade. If price rises, buyers generally accepted progressively higher offers. If price falls, sellers generally accepted lower bids.
Even then, the interpretation remains incomplete.
Rising price and volume may reflect sustained demand, but they may also reflect short covering, liquidation pressure, thin ask liquidity, a listing event, or leveraged speculation. Falling price and high volume may represent distribution, panic, forced deleveraging, or capitulation into stronger buyers.
Volume confirms disagreement and activity.
It does not identify which side will ultimately be right.
2. The Same Capital Can Generate Volume Repeatedly
Trading volume should not be confused with the amount of new money entering a market.
Suppose a trader deposits $20,000 and repeatedly buys and sells the same token during the day. That capital can generate several hundred thousand dollars of turnover without adding an equivalent amount of net demand.
Market makers operate on a much larger scale. Their role often involves quoting both sides, trading frequently, hedging inventory across venues, and earning spreads rather than maintaining a large directional position.
Perpetual markets amplify this effect further because leverage allows traders to create notional exposure larger than their posted collateral. Positions can be opened, reduced, reversed, liquidated, and reopened while the underlying capital base remains much smaller than the resulting volume.
This does not make the activity fake. It means volume measures turnover, not committed capital.
A stronger analysis asks whether the activity is accompanied by:
- Rising open interest.
- Spot inflows or outflows.
- Improved market depth.
- Changes in exchange balances.
- Persistent wallet accumulation.
- Greater protocol usage.
- Higher fees or revenue.
- Sustained activity after incentives disappear.
Without those additional layers, large volume may represent capital moving in circles.
3. High Volume Does Not Guarantee Usable Liquidity
This is the most consequential mistake investors make with the crypto volume signal.
Volume looks backward. It shows completed transactions.
Liquidity is forward-looking. It determines whether the next transaction can be executed efficiently.
A token can report high daily volume while maintaining thin order books, wide spreads, fragmented pools, and severe slippage for realistic trade sizes. The reported activity may have occurred through small transactions, rapid market-maker turnover, derivatives, or venues unavailable to the investor.
The practical test is not: How much traded today?
It is: How much can I trade now without moving the market materially?
BlockCodex’s guide to market depth in crypto explains why liquidity close to the current price matters more than a large volume total. A market with substantial bids and asks within 0.5% or 1% can absorb more pressure than one whose liquidity sits far away from the midpoint.
This difference becomes critical during stress. Quotes that appear during calm conditions may shrink when volatility rises, market makers reduce exposure, and many investors attempt to exit simultaneously.
Volume can look impressive right until the market is asked to absorb a real sell order.
4. Volume Quality Depends on Where It Happens
Crypto liquidity is fragmented across centralized exchanges, decentralized exchanges, derivatives platforms, trading pairs, blockchains, and liquidity pools.
A token does not possess one universal pool of volume.
It may report most of its activity on one exchange, while another venue has almost no meaningful bids. A DEX pair against USDC may offer decent execution, while a pair against the token’s native asset remains shallow. Aggregate market figures can combine markets with very different quality, transparency, accessibility, and settlement risk.
A useful volume review should therefore identify:
- The exact venue.
- The trading pair.
- Spot or derivatives.
- Centralized or decentralized execution.
- The relevant blockchain and pool.
- The share of volume concentrated on the largest venue.
- Whether prices remain aligned across exchanges.
- Whether comparable depth exists where the investor will trade.
Volume concentrated on credible, liquid venues generally carries more analytical weight than activity concentrated on obscure platforms with thin books and inconsistent pricing.
It is still not proof of organic demand.
It is simply better-quality evidence.
5. Bots, Incentives, and Wash Trading Can Inflate the Signal
Not all weak-quality volume is outright fraud.
Some volume comes from genuine transactions that would probably not occur without rewards. Points programs, fee rebates, trading competitions, liquidity mining, token incentives, and expected airdrops can all encourage users to trade more frequently than normal economic demand would justify.
That activity is real at the transaction level but may be temporary.
The decisive question is what remains after the incentive ends.
If users stay, liquidity persists, and fees continue without subsidies, the campaign may have introduced participants to a useful product. If volume collapses immediately, the protocol rented activity rather than building durable demand.
Bots create a similar interpretation problem. They may provide arbitrage, routing, liquidation, or market-making services that improve market efficiency. They can also generate repetitive activity that inflates user counts and trading totals without representing broad adoption.
CoinGecko explicitly noted in a May 2026 analysis of Pump.fun traders that bot and wash-trading activity had not been filtered out and could inflate wallet counts and trading volume. That methodological warning is valuable because it shows why even transparent datasets require careful reading.
Wash trading goes further by creating transactions primarily to manufacture the appearance of activity. Chainalysis estimated that suspected wash trading accounted for up to $2.6 billion in volume in its market-integrity research, while individual controller addresses sometimes generated extraordinarily large totals.
BlockCodex covers the practical warning signs in Fake Volume in Crypto.
The important point is not to assume that every active market is manipulated. It is to stop treating activity itself as proof of market quality.
6. Derivatives Volume Can Be Loud While Spot Demand Remains Quiet
Perpetual markets often dominate crypto trading activity because they make leverage, short exposure, hedging, and rapid position changes easier.
That makes derivatives volume important, but also easy to misread.
Suppose price rises while perpetual volume and open interest expand rapidly, funding becomes increasingly positive, and spot volume remains weak. The market may continue rising, but the structure is increasingly dependent on leveraged traders.
If momentum slows, crowded positions can unwind quickly. Liquidations then create another surge in volume, even though the activity now reflects forced exits rather than new conviction.
The same volume number can therefore appear during both expansion and collapse.
A better derivatives framework combines:
| Metric | What It Adds |
|---|---|
| Perpetual volume | Contract turnover |
| Open interest | Outstanding leveraged exposure |
| Funding rate | Cost and crowding of positioning |
| Liquidations | Forced position closures |
| Spot volume | Underlying asset turnover |
| Market depth | Ability to absorb the resulting pressure |
Volume without these metrics cannot distinguish a healthy expansion from a leverage loop approaching instability.
7. The Meaning of Volume Changes Across the Market Cycle
A volume surge does not carry the same meaning in every market phase.
During accumulation, volume may remain subdued because long-term buyers build positions gradually without chasing price. Low activity does not automatically mean weak conviction.
During expansion, rising spot volume can support a breakout when it appears alongside stronger liquidity, broader participation, and new capital entering the market.
Later in the cycle, activity may accelerate as retail interest, leverage, token rotations, and speculative trading increase. The highest volume can arrive close to a market top because ownership is being transferred aggressively from earlier holders to late participants.
During a reset, liquidation waves and panic selling can produce another extreme volume spike. The activity is large, but it reflects distress rather than healthy growth.
The same headline—“volume reaches a record”—can therefore describe several incompatible market conditions.
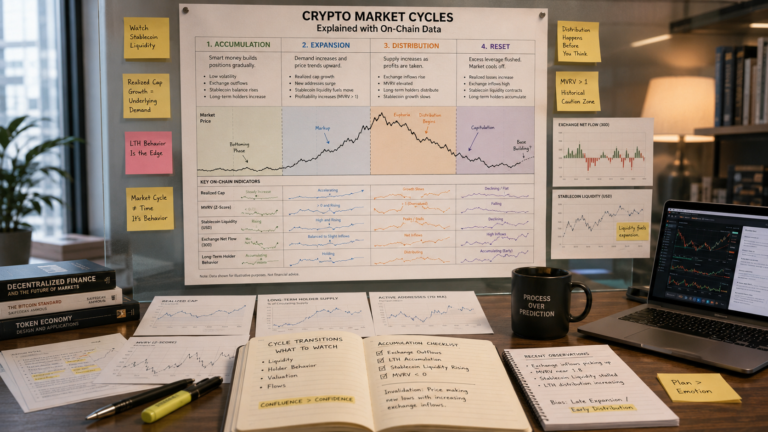
BlockCodex’s guide to Crypto Market Cycles Explained examines how capital behavior, stablecoin liquidity, holder activity, and leverage change across accumulation, expansion, distribution, and reset phases.
Volume becomes useful only after the cycle context is understood.
Why On-Chain Volume Also Needs Adjustment
On-chain data may appear more trustworthy because transactions are publicly recorded.
The raw records are real, but their economic interpretation can still be wrong.
A blockchain may record:
- Transfers between wallets controlled by the same entity.
- Exchange internal movements.
- Bridge transactions.
- Smart-contract routing.
- Market-maker rebalancing.
- Token wrapping and unwrapping.
- Arbitrage.
- Bot transactions.
- Wash trading.
- Payments and settlement.
Adding every transfer together can produce an impressive total without revealing the amount of genuine economic activity between independent participants.
Chainalysis distinguishes raw stablecoin volume from adjusted volume, which attempts to filter noise such as internal transfers and wash trading to better estimate real economic use.
This illustrates a broader rule:
Transparent data is not automatically clean data.
A blockchain can accurately record an action while the analyst still misunderstands what that action represents.
That is one of the central problems explored in On-Chain Data: 7 Critical Reasons Most Investors Misread Blockchain Signals.
A Strong Crypto Volume Signal Requires Confirmation
Volume becomes more useful when independent signals tell a compatible story.
A strong confirmation framework can be built around seven questions.
Where Did the Volume Occur?
Separate spot, perpetual, centralized, decentralized, and on-chain activity. Do not combine fundamentally different markets into one narrative.
Did Price Respond Normally?
Large volume with almost no price response may indicate strong absorption, market-maker turnover, or repetitive activity. The surrounding context determines which explanation is more credible.
Was Liquidity Deep Enough?
Compare the reported activity with spreads, nearby market depth, and expected slippage for a realistic position.
Did Exposure Build?
In derivatives markets, add open interest, funding, and liquidations. This shows whether traders added leverage, closed positions, or recycled existing contracts.
Did On-Chain Behavior Confirm It?
Look for wallet accumulation, exchange flows, stablecoin movement, user activity, or protocol usage that supports the market narrative.
Did the Activity Create Economic Value?
For a protocol or DEX, compare volume with fees, revenue, liquidity retention, and returning users.
Did It Persist?
One day of intense activity may reflect news, incentives, a listing, liquidations, or manipulation. Persistent activity across several periods is harder to manufacture and generally more informative.
No answer proves that a market is healthy.
Together, they make the crypto volume signal more difficult to misread.
Four Volume Patterns That Look Similar but Mean Different Things
A Spot-Led Breakout
Price rises alongside stronger spot volume, healthy market depth, moderate derivatives positioning, and broader on-chain participation.
This structure suggests that underlying demand is helping drive the move. It can still reverse, but the rally is less dependent on leverage alone.
A Leverage-Led Rally
Price rises while perpetual volume and open interest expand faster than spot activity. Funding becomes expensive and liquidations increasingly affect short-term price action.
The move may remain powerful, but it becomes more vulnerable to a sharp reset.
A High-Volume Sell-Off
Price falls with heavy volume.
The interpretation depends on open interest, market depth, exchange flows, and subsequent price behavior. Falling open interest may point toward deleveraging, while persistent spot outflows from holders may indicate broader distribution.
A High-Volume Market With Poor Execution
The asset reports strong turnover, yet spreads are wide and moderate orders create large price impact.
This is the clearest example of why volume alone is weak. The activity exists, but it does not translate into usable liquidity for the investor.
A Practical Volume Quality Scorecard
Before treating volume as confirmation, review the surrounding structure.
| Question | Stronger Pattern | Weaker Pattern |
|---|---|---|
| Venue quality | Several credible, liquid venues | Concentrated on one weak venue |
| Market depth | Strong liquidity near the price | Thin books despite high volume |
| Spread | Stable and relatively tight | Wide or unstable |
| Price response | Activity produces understandable movement | Repetitive volume with little context |
| Spot participation | Spot supports the move | Derivatives dominate completely |
| Open interest | Controlled exposure growth | Vertical leverage expansion |
| On-chain context | Activity, flows, or usage confirm | Blockchain activity remains flat |
| Economic value | Fees and users persist | Activity disappears with incentives |
| Time | Volume remains durable | One isolated spike |
The scorecard is not a mathematical model.
Its purpose is to prevent one large number from replacing analysis.
When Volume Is Actually Useful
Calling volume a weak standalone signal does not make it useless.
Volume is valuable when it answers a specific question.
It can show whether:
- A breakout attracted participation.
- A sell-off involved broad activity.
- A market event changed trader behavior.
- A liquidation wave accelerated deleveraging.
- An incentive campaign increased usage.
- One venue gained market share.
- Market activity is expanding or contracting.
- A previous low-volume trend is becoming more widely traded.
Its best role is confirmation.
Volume can strengthen a thesis built from price structure, liquidity, positioning, on-chain behavior, and market context. It should not create the thesis by itself.
The hierarchy matters:
Context first. Mechanism second. Volume third.
Starting with volume often leads investors to invent a story around the number. Starting with the market question makes it easier to decide whether the volume is relevant at all.
Final Thoughts
Volume is one of crypto’s most visible metrics, but visibility should not be confused with explanatory power.
The number proves that transactions occurred. It does not prove that new capital entered, that buyers are accumulating, that liquidity is deep, that users are organic, or that the market can absorb a meaningful exit.
Those questions require other evidence.
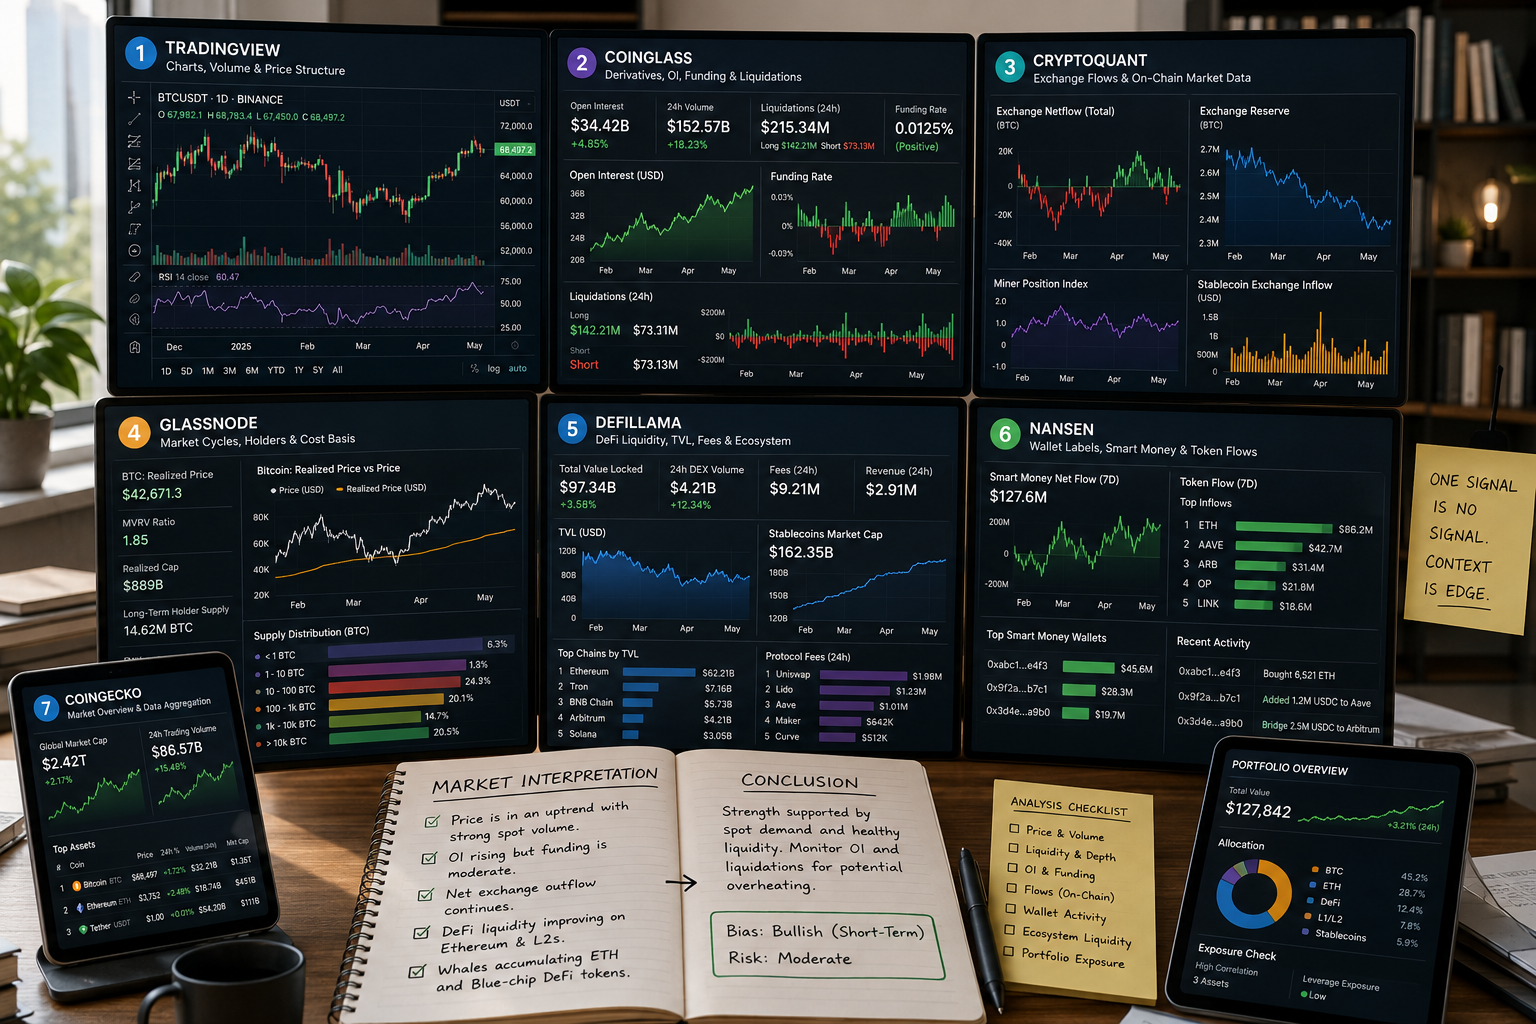
Market depth shows whether liquidity is available near the price. Spreads and slippage reveal execution quality. Open interest and funding explain derivatives positioning. On-chain data can show whether assets, stablecoins, or users are moving in ways that support the narrative. Fees and retention help determine whether protocol activity creates durable value.
Used alone, the crypto volume signal compresses too many conflicting behaviors into one total.
Used in context, it becomes useful.
The edge does not come from noticing that volume increased. Every trading platform can show that.
The edge comes from understanding what kind of activity produced the increase, whether the market could absorb it, and what remained after the noise faded.