Growth is one of the easiest stories to manufacture in crypto.
A blockchain reports more active addresses. A protocol’s TVL rises. Trading volume accelerates. Developer activity expands. Stablecoins enter the ecosystem, token prices increase, and several new applications appear within the same quarter.
Individually, each metric looks constructive. Together, they can make the growth thesis feel undeniable.
Yet the same dashboard can describe a very different reality: addresses created to farm incentives, TVL inflated by asset prices, capital rotating between related protocols, temporary trading activity driven by rewards, and applications that attract users only while subsidies remain available.
The numbers are not necessarily false.
The interpretation is incomplete.
This is why crypto growth signals are so often misread. Investors see movement and assume progress, even though growth requires more than a larger number. It requires conversion: attention must become repeated behavior, activity must become useful demand, and capital must remain after the original incentive weakens.
A healthy ecosystem does not merely become busier.
It becomes harder to replace.
Table of Contents
Crypto Growth Is a Conversion Process
Most dashboards present growth as a collection of rising lines.
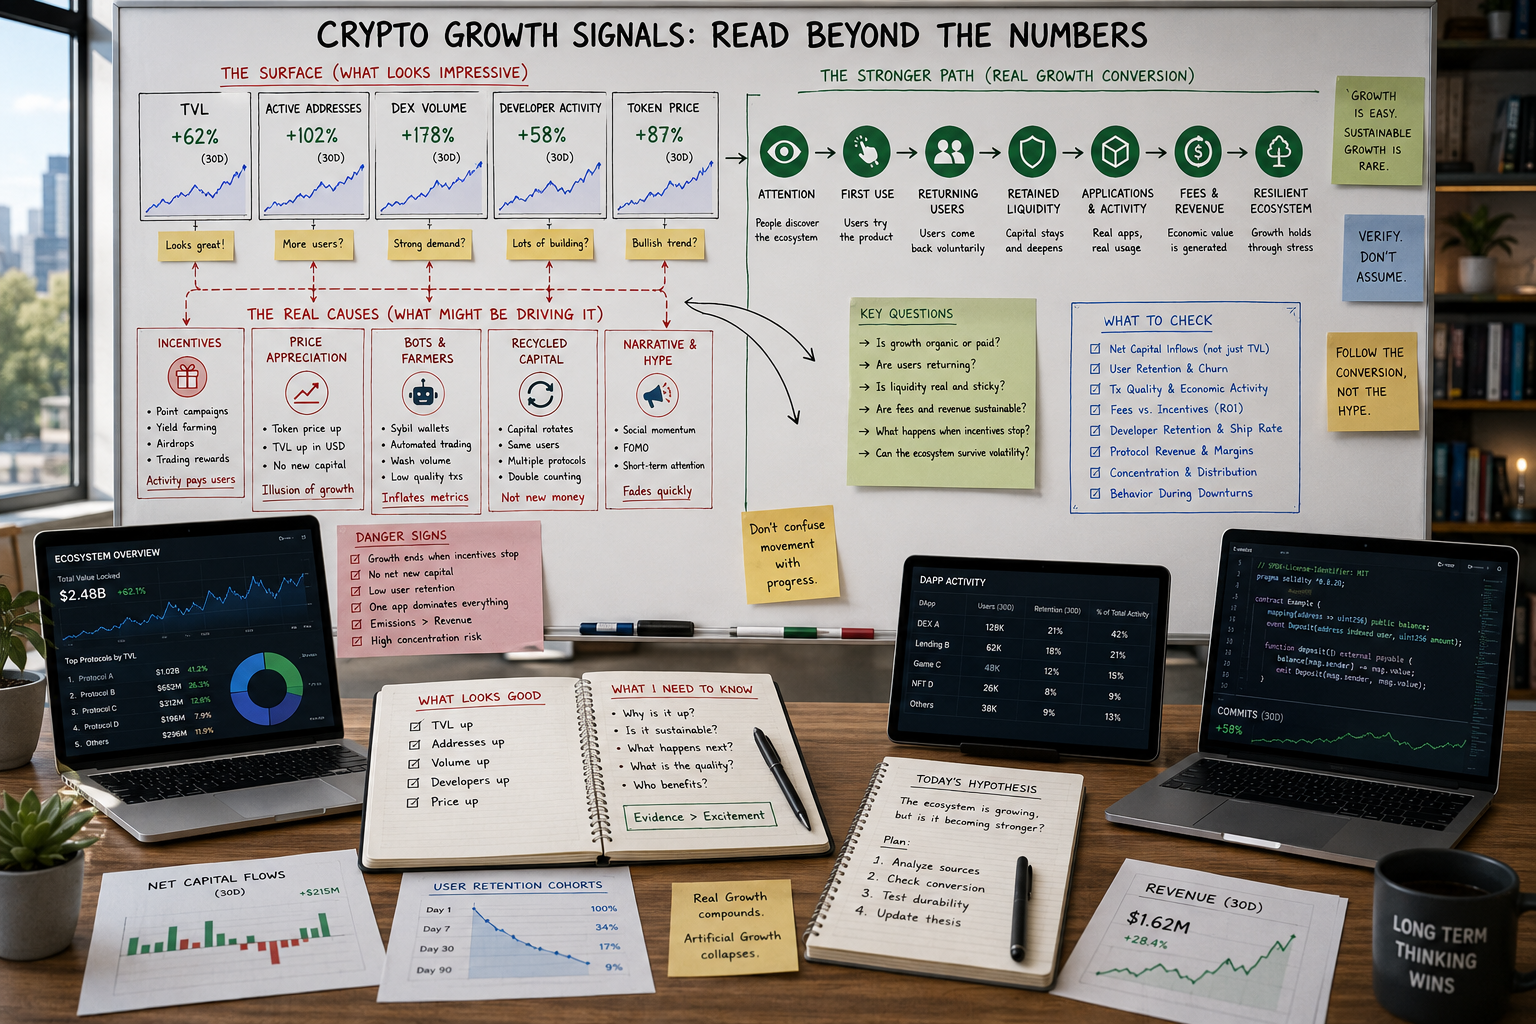
Real ecosystem growth behaves more like a conversion process:
Attention → First interaction → Repeated use → Retained capital → Economic activity → Resilience
Each stage filters out weaker forms of participation.
A marketing campaign can generate attention. An airdrop can create first interactions. Token rewards can keep users active temporarily. Rising prices can increase the dollar value of deposited capital without attracting a single new investor.
The stronger evidence appears later in the chain.
Do users return when rewards decline? Does liquidity remain available during volatility? Do applications continue generating fees? Are developers maintaining infrastructure after the narrative cools? Can the ecosystem support several products rather than one dominant application?
Growth becomes more credible when the earlier stages convert into the later ones.
| Stage | Weak Interpretation | Stronger Question |
|---|---|---|
| Attention | Social interest proves adoption | Does attention produce real activity? |
| Activity | More transactions mean more users | Are transactions economically meaningful? |
| Users | More addresses mean more people | Are independent users returning? |
| Capital | Higher TVL means more deposits | Did new capital enter, or did asset prices rise? |
| Developers | More commits mean stronger building | Are maintainers shipping usable products? |
| Volume | More trading means deeper demand | Can the market absorb realistic orders? |
| Fees | More fees mean sustainable value | Who receives the fees, and do they persist? |
The most common analytical mistake is stopping at the first visible increase.
The Four Types of Crypto Growth
Not all growth is equally valuable.
A useful framework separates four different sources.
Organic Growth
Users participate because the product solves a problem. They return without needing constant rewards, capital remains active, and economic activity continues after promotional campaigns end.
Purchased Growth
The ecosystem pays users through tokens, points, grants, fee rebates or liquidity incentives. Purchased growth can help a product reach critical mass, but it becomes expensive when users leave as soon as payments stop.
Borrowed Growth
Activity is funded by future token emissions, treasury spending or unsustainable yields. The ecosystem appears stronger today by creating obligations that may weaken it later.
Recycled Growth
The same users, capital or transactions move repeatedly between wallets, protocols and applications. Gross activity rises, but the underlying economic base changes very little.
These categories can overlap. A successful protocol may initially purchase adoption and later convert those users into organic demand.
The analytical challenge is determining which type currently dominates.
1. Investors Confuse Price Appreciation With Capital Growth
TVL is one of the clearest examples.
DeFiLlama defines protocol TVL as the value of coins held in a protocol’s smart contracts. Chain TVL is the combined TVL of protocols on that network. Because the value is generally expressed in dollars, it can rise when deposited assets appreciate even if no additional tokens enter the system.
Suppose a protocol holds one million units of a token worth €2 each.
Its TVL is approximately €2 million.
If the token price rises to €3 while the deposited quantity remains unchanged, reported TVL becomes approximately €3 million. The dashboard shows 50% growth, but the protocol did not necessarily attract new capital.
The opposite can also happen. Token-denominated deposits may rise while the dollar TVL falls because prices declined.
A stronger TVL review separates:
- Dollar-denominated TVL.
- Token-denominated balances.
- Net deposits and withdrawals.
- Stablecoin liquidity.
- Asset concentration.
- Capital supplied by incentives.
- Capital remaining after rewards decline.
The same principle applies to ecosystem market capitalization, treasury value and collateral totals.
Price can make an ecosystem look larger before its underlying behavior improves.
For a deeper framework, see How to Read TVL in Crypto.
2. Incentives Can Rent Activity Without Building Loyalty
A protocol launches a points program.
Transactions increase. New wallets arrive. Deposits rise, volume expands and the ecosystem becomes one of the most discussed opportunities on social media.
The temptation is to label the campaign a success.
The harder test begins when the reward becomes less attractive.
Incentives are not automatically a weakness. They can solve the cold-start problem by giving users a reason to test a new product before network effects exist. Liquidity rewards can make a market usable, while grants can help developers build the first generation of applications.
The problem appears when incentives become the product.
A user who swaps solely to accumulate points is not demonstrating demand for the exchange. A depositor chasing a temporary yield is not necessarily committed to the protocol. A wallet returning every week to preserve a streak may disappear immediately after the snapshot.
The most useful metric is therefore not the peak.
It is the post-incentive floor.
Ask:
- How much activity remains after rewards fall?
- Do users continue using the application voluntarily?
- Does liquidity remain deep enough for normal execution?
- Do fees persist without subsidies?
- Are users adopting additional ecosystem products?
- Is the protocol retaining capital or repeatedly replacing it?
Purchased activity becomes valuable only when some of it converts into unpaid behavior.
Otherwise, the ecosystem is renting growth rather than owning it.
3. Active Addresses Are Not the Same as Active Users
Address counts are attractive because blockchains make them easy to measure.
People are harder.
One person may control several addresses. Exchanges may use many operational wallets. Bots can create and use accounts automatically. Applications can generate subaccounts, while cheap networks make repeated wallet creation inexpensive.
Coin Metrics describes active addresses as a useful proxy for network users, but it also warns that definitions vary across blockchains and that counts can be easily inflated where account creation and transactions are inexpensive. The metric may include staking, voting, reward claims, failed transactions and other ledger changes depending on the protocol. Solana figures, for example, include owner accounts and subaccounts.
This does not make active-address data useless.
It means the metric must be interpreted according to the chain’s architecture.
A stronger user-growth analysis examines:
- Returning addresses.
- New versus existing addresses.
- Economically active addresses.
- Average activity per address.
- Application-level retention.
- Wallet clusters.
- Transaction value.
- Contract interactions.
- Activity after incentives.
- Unique users across several applications.
Ten thousand addresses completing one subsidized transaction are not necessarily stronger evidence than two thousand users returning weekly to perform several meaningful actions.
The first group is larger.
The second may be more valuable.
This distinction is central to Why Most Investors Misread On-Chain Data.
4. Investors Mistake Capital Motion for Capital Formation
Crypto capital moves constantly.
It passes from exchanges to wallets, from one blockchain to another, from spot assets into lending markets, and from one liquidity campaign to the next. Every movement creates measurable activity.
But movement does not always mean expansion.
Suppose €100 million leaves Ecosystem A and enters Ecosystem B. Ecosystem B reports a strong inflow, but the total capital available across both ecosystems remains unchanged.
Now suppose the same capital is bridged, supplied to a lending protocol, borrowed against, deposited into a liquidity pool and staked through another application. Several dashboards may record growth from the same original capital.
This is not fraudulent. It is composability.
It also creates double-counting risk.
A stronger ecosystem-growth review distinguishes between:
- Gross inflows.
- Net inflows.
- Capital originating outside the ecosystem.
- Capital moved between internal protocols.
- Leveraged or recursively deposited capital.
- Stablecoin growth.
- Native-token appreciation.
- Capital retained over time.
Stablecoins are particularly useful because they can provide a cleaner view of deployable liquidity than volatile native assets, although their purpose still matters. Stablecoins may enter for trading, lending, payments, market making, collateral or defensive positioning.
Capital movement is evidence.
Net capital formation is a stronger signal.
5. High Activity Can Hide Weak Economics
A network can process more transactions without creating more sustainable value.
Low fees, bots, incentives and repetitive interactions may produce impressive activity while contributing little to protocol economics. The opposite is also possible: a smaller number of valuable transactions may generate meaningful demand and revenue.
This is where investors often mix up three different metrics:
- Activity: what users do.
- Fees: what users pay.
- Revenue: what the protocol retains.
DeFiLlama defines fees as the total amount paid by users for a protocol’s services. Revenue is the portion retained by the protocol, treasury, team or token holders rather than distributed to other participants such as liquidity providers.
That distinction matters.
A protocol may generate large fees while retaining very little. Another may retain revenue but depend on token incentives that cost more than it earns. A third may temporarily subsidize users in order to grow, with a credible path toward better economics later.
The relevant questions are:
- Are users paying voluntarily?
- Are fees increasing because usage improved or because transactions became more expensive?
- How much value does the protocol retain?
- What does it spend to generate that activity?
- Are token emissions larger than protocol revenue?
- Does the economic model improve as usage scales?
Growth should not be measured only by what moves through the system.
It should also be measured by what the system can sustain.
6. Investors Count Developers Without Following What They Produce
Developer activity is a powerful leading indicator because applications, infrastructure and security improvements begin with technical work.
It is also easy to turn into a promotional ranking.
One ecosystem reports more developers. Another reports more commits. A third announces hundreds of new repositories after a hackathon. The numbers are presented as evidence that future adoption is inevitable.
The conversion is not automatic.
Electric Capital’s latest complete annual Developer Report remains the 2024 edition, while its public Open Dev Data dashboards continued receiving updated ecosystem data into 2026. The 2024 report found that total crypto developers declined by 7%, while established developers with at least two years of tenure grew by 27% and produced 70% of measured code commits.
Those figures tell two different stories.
The first suggests contraction.
The second suggests that experienced contributors became more important.
This is why developer growth should be evaluated through:
- Contributor retention.
- Full-time and established developers.
- Independent teams.
- Maintained infrastructure.
- Product releases.
- Documentation and tooling.
- Applications launched.
- Users retained.
- Economic activity created.
- Development during weak market periods.
A burst of new contributors may reflect attention. Experienced maintainers who continue shipping through difficult conditions reveal durability.
The full framework is explained in Developer Activity in Crypto: What It Really Signals.
Code is a starting point.
Growth appears when the code becomes something people repeatedly use.
7. Investors Interpret Growth Through Their Existing Position
Growth analysis is not performed in an emotional vacuum.
An investor who already owns a token wants rising metrics to confirm the position. A person who missed the rally may search for signs that the activity is artificial. Someone who sold early may interpret slowing growth as proof that the exit was correct.
The same dashboard becomes evidence for several incompatible stories.
Confirmation bias is particularly powerful in crypto because nearly every metric contains ambiguity. Rising exchange inflows can suggest possible selling, collateral preparation or market-making activity. Higher active addresses can represent users, bots or incentives. Growing TVL can reflect deposits or price appreciation.
This flexibility allows investors to choose the explanation that best protects their existing belief.
The market price then creates a feedback loop:
- Price rises.
- Attention increases.
- More users and capital enter.
- Metrics improve.
- Investors interpret the metrics as proof that the original price move was fundamentally justified.
- Higher conviction attracts more activity.
The loop can be productive when the ecosystem converts attention into lasting adoption. It becomes fragile when activity depends on the price continuing to rise.
BlockCodex explores this behavioral layer in Crypto Investor Psychology.
A useful discipline is to write two interpretations of every major growth signal:
The strongest explanation supporting the thesis
and
The strongest explanation weakening the thesis
If the bullish interpretation is the only one being considered, the research is probably incomplete.
The Denominator Problem
Growth percentages look impressive when the starting point is small.
An ecosystem increasing monthly users from 1,000 to 3,000 has grown by 200%. Another moving from one million to 1.1 million users has grown by only 10%.
The first has the higher growth rate.
The second added far more users.
Neither number is automatically more important. The correct interpretation depends on maturity, retention, market size and the quality of the added activity.
Investors should review both:
- Percentage growth.
- Absolute growth.
- Starting base.
- Time period.
- Comparable ecosystems.
- Cost of acquiring the growth.
- Retention after acquisition.
A small ecosystem can grow rapidly for years without approaching the liquidity, infrastructure or product diversity of an established network.
A large ecosystem can grow slowly while strengthening its dominant position.
Percentages create excitement.
Scale provides context.
The Concentration Problem
Aggregate ecosystem growth can conceal dependence on one application.
A chain may report rising TVL, users, volume and fees because one DEX, gaming application or memecoin platform is expanding rapidly. The ecosystem appears diversified when most of its activity depends on one product or narrative.
Concentration creates fragility.
If the leading application loses users, changes chains, suffers an exploit or faces regulatory pressure, the ecosystem’s headline metrics can decline together.
A stronger review asks:
- What share of TVL belongs to the top protocol?
- How much volume comes from the largest application?
- Are fees distributed across several categories?
- Does the ecosystem have lending, trading, payments, infrastructure and consumer applications?
- Are users active across multiple products?
- Would the chain remain relevant without its current leading narrative?
Growth is more durable when several independent products attract capital and users for different reasons.
For the broader ecosystem framework, see What Drives Growth in Crypto Ecosystems.
The Time-Horizon Problem
Investors often compare fast-moving metrics with slow-moving conclusions.
A week of rising addresses becomes evidence of adoption. One month of developer growth becomes proof of a superior ecosystem. A quarter of TVL expansion becomes a long-term investment thesis.
The time horizons do not match.
Some growth signals respond immediately to campaigns, token prices and market narratives. Others require several months before their quality becomes visible.
| Signal | Can Change Quickly | Needs Longer Confirmation |
|---|---|---|
| Transaction count | Yes | Economic quality and persistence |
| Active addresses | Yes | User identity and retention |
| TVL | Yes | Net deposits and capital stability |
| Volume | Yes | Liquidity quality and organic demand |
| Developer onboarding | Yes | Contributor retention and releases |
| Application launches | Yes | Returning users and economics |
| Fees | Yes | Sustainable revenue and margins |
A short-term spike can be important.
It should not be given a long-term meaning before enough time has passed to test it.
Growth is not only about how high a metric rises.
It is about what remains after the catalyst disappears.
A Better Crypto Growth Signals Framework
A practical growth review can follow six layers.
Layer 1: Source
What caused the metric to rise?
Was it price appreciation, incentives, a product launch, market speculation, genuine user demand or movement from another ecosystem?
Layer 2: Quality
What kind of behavior is being measured?
Separate users from addresses, deposits from asset appreciation, spot demand from leveraged turnover, and product releases from repository activity.
Layer 3: Conversion
Did the initial activity lead to deeper engagement?
Check whether first-time users returned, deposits remained, developers shipped and new applications gained actual usage.
Layer 4: Economics
Did the growth create sustainable value?
Compare fees, revenue, liquidity costs, token emissions and the amount spent to attract activity.
Layer 5: Distribution
Is growth spread across users, applications and capital sources?
A diversified ecosystem is generally less dependent on one whale, protocol, team or narrative.
Layer 6: Resilience
What happened during stress?
Review behavior after rewards declined, token prices corrected, volatility increased or the market narrative moved elsewhere.
A convincing growth thesis should survive all six layers.
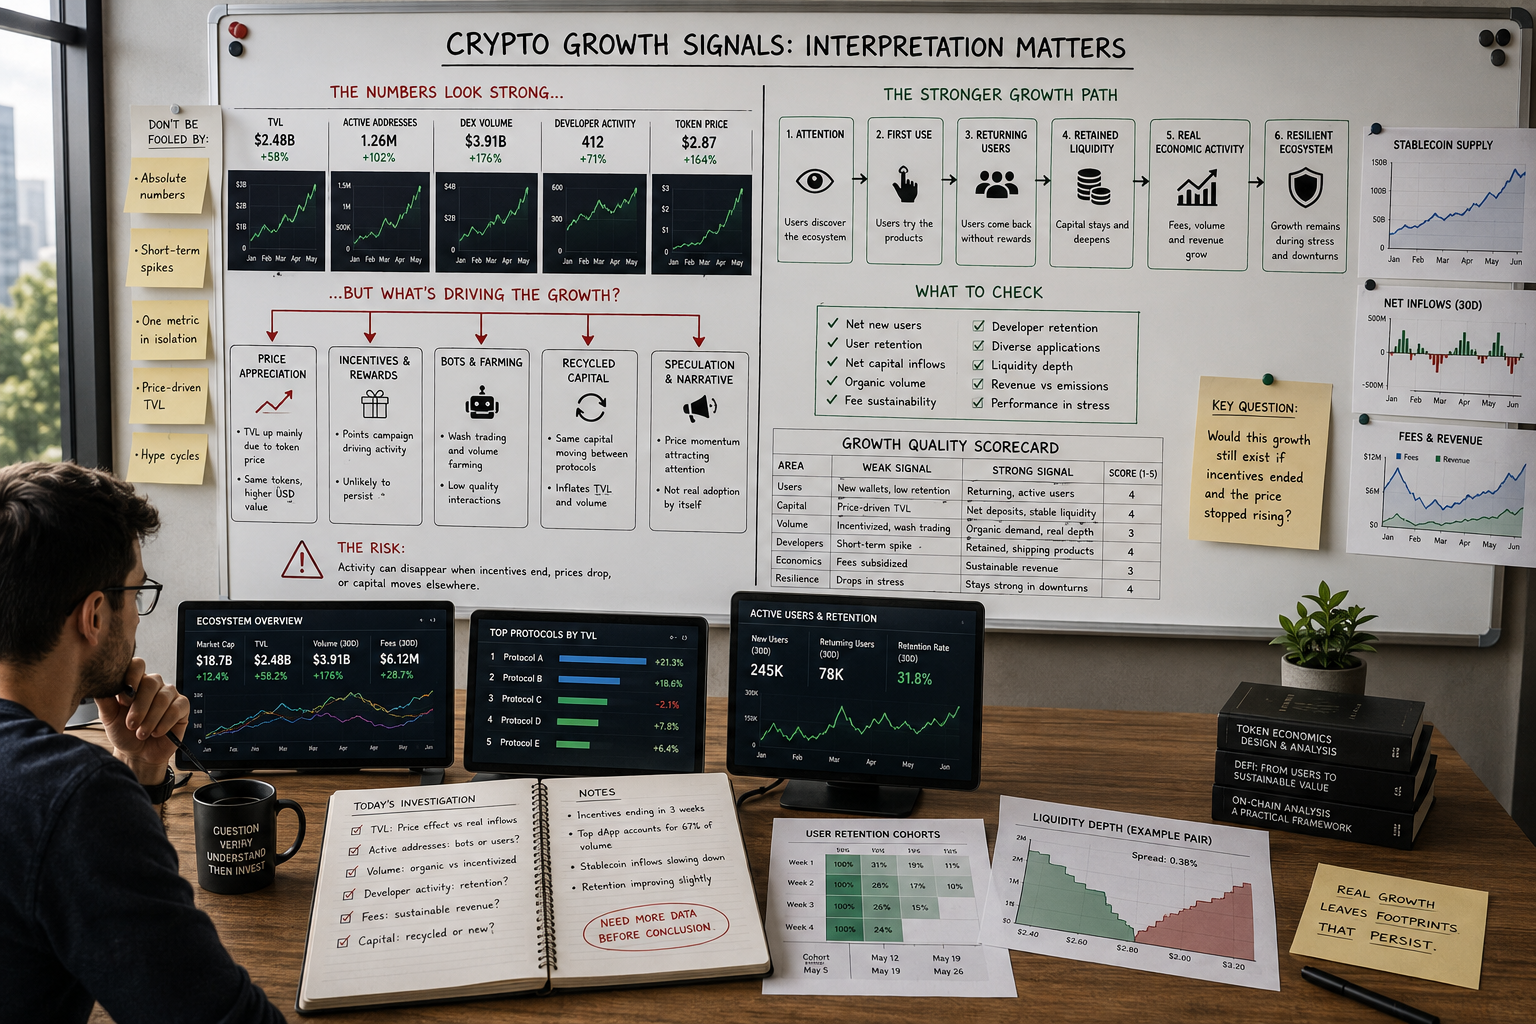
A Crypto Growth Signals Scorecard
| Research Area | Stronger Signal | Warning Signal |
|---|---|---|
| Users | Returning, economically active users | One-time subsidized wallets |
| Capital | Net deposits and stable liquidity | TVL rising mainly with token prices |
| Volume | Persistent activity with real depth | High turnover and poor execution |
| Economics | Fees and revenue persist | Activity depends on larger emissions |
| Developers | Retained contributors shipping products | Hackathon spikes and abandoned repos |
| Applications | Several products retain users | One application dominates everything |
| Liquidity | Deep markets across key assets | Capital fragmented or incentive-dependent |
| Distribution | Broad user and capital base | Activity concentrated in a few wallets |
| Stress behavior | Metrics remain functional during volatility | Liquidity and users disappear together |
| Time | Growth persists across several periods | One short-lived campaign spike |
The scorecard is not designed to produce one perfect number.
Its purpose is to prevent one attractive metric from becoming the entire thesis.
An Example of Misread Ecosystem Growth
Imagine an ecosystem reporting the following quarter:
- TVL rises by 60%.
- Active addresses double.
- DEX volume triples.
- Five new applications launch.
- Social engagement reaches a record.
- The native token appreciates strongly.
The first interpretation is obvious: the ecosystem is accelerating.
A deeper review finds that most TVL growth came from the native token price, 70% of DEX volume came from one points campaign, active addresses rarely returned after their first week, and four of the new applications remained dependent on treasury incentives.
The ecosystem still grew.
But it grew differently from the headline narrative.
Now imagine that six months later, stablecoin liquidity remains elevated, several applications retain users without rewards, developer tooling improves, and fees remain above their pre-campaign level.
The original incentives may have produced genuine conversion.
That is the difference between weak and strong growth analysis.
The correct conclusion often cannot be reached on the day the metric first rises.
Questions to Ask Before Calling an Ecosystem “Growing”
Before accepting a growth narrative, ask:
- What caused the increase?
- Is the metric denominated in tokens or dollars?
- How much activity came from incentives?
- Are users returning?
- Are addresses economically meaningful?
- Did net capital enter?
- Is liquidity deep enough to support exits?
- Are developers remaining and shipping?
- Are applications generating fees?
- Does the protocol retain revenue?
- Is growth diversified?
- What happened after the catalyst weakened?
- Would the activity continue if the token price stopped rising?
The last question is especially useful.
An ecosystem whose growth depends entirely on price appreciation may remain strong while the market rises. The weakness becomes visible only after the feedback loop reverses.
Final Thoughts
Crypto investors rarely misread growth because the data is entirely false.
They misread it because the data captures only one stage of a longer process.
TVL can rise before new capital arrives. Addresses can multiply before users become loyal. Volume can surge without deeper liquidity. Developers can appear before usable products ship, while incentives can create activity that disappears as quickly as it arrived.
The strongest crypto growth signals show conversion.
Attention becomes repeat use. Deposits remain after rewards fall. Developers become maintainers. Applications retain users. Liquidity survives stress, and economic activity continues without increasingly expensive subsidies.
That form of growth usually looks less dramatic than a sudden spike.
It is also harder to manufacture.
The purpose of growth analysis is not to find the largest number on a dashboard. It is to understand what produced the number, what it converted into and what would remain if the original catalyst disappeared.
A rising metric tells investors that something changed.
Durable growth explains why the change should continue.