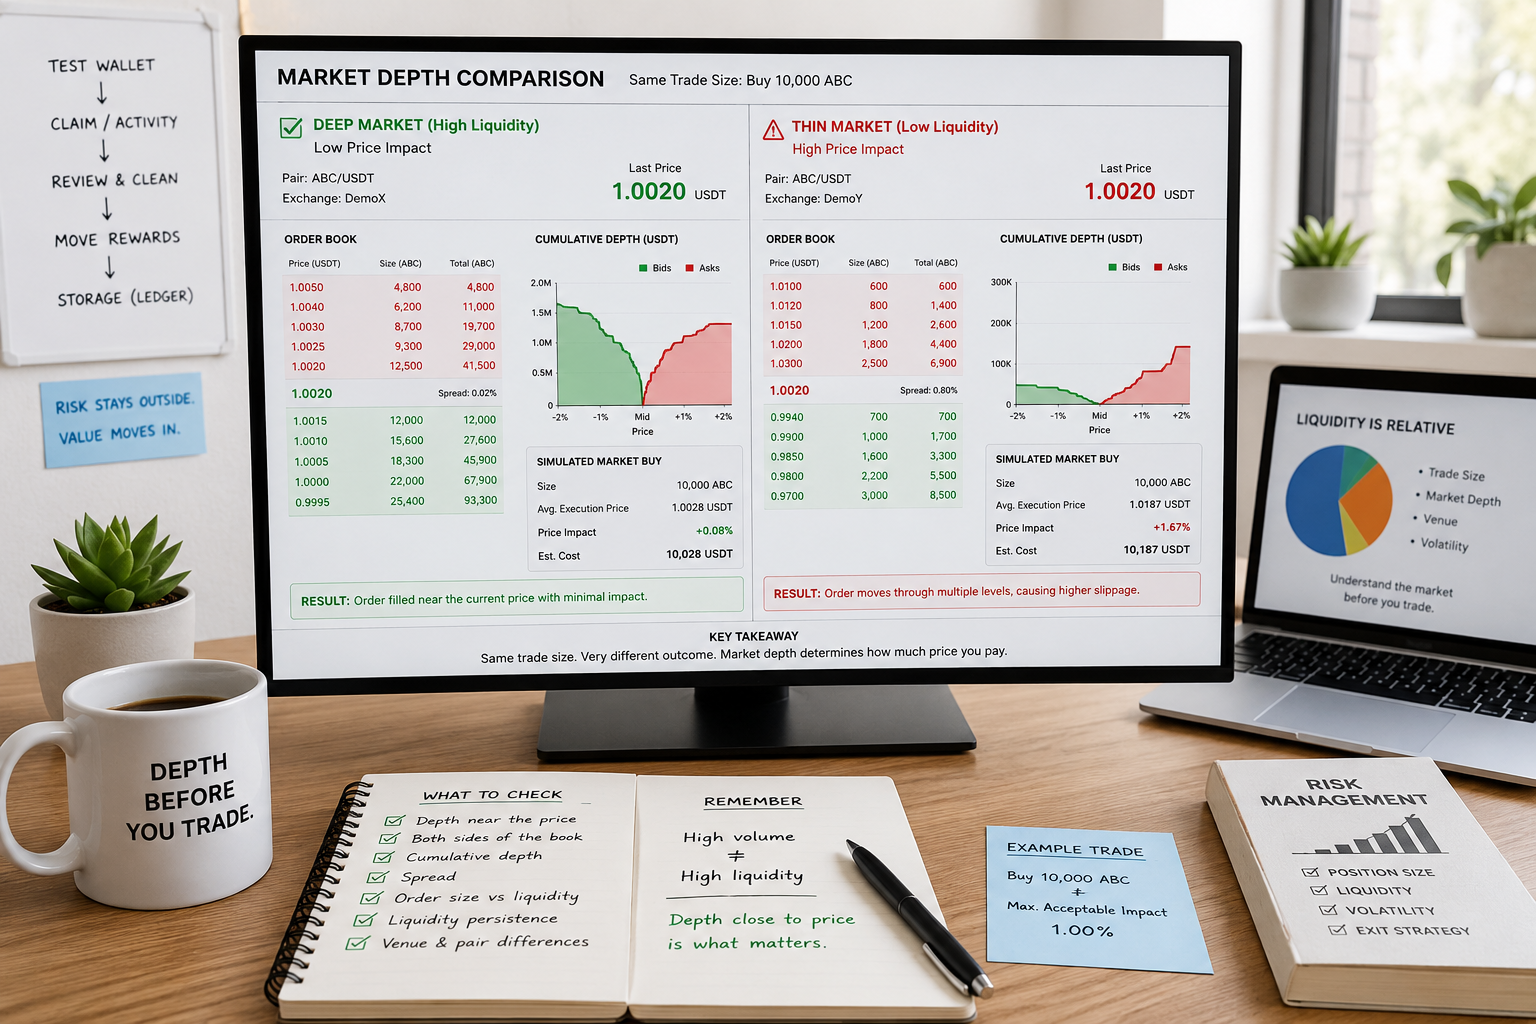
A $10,000 crypto trade is not always a $10,000 trade.
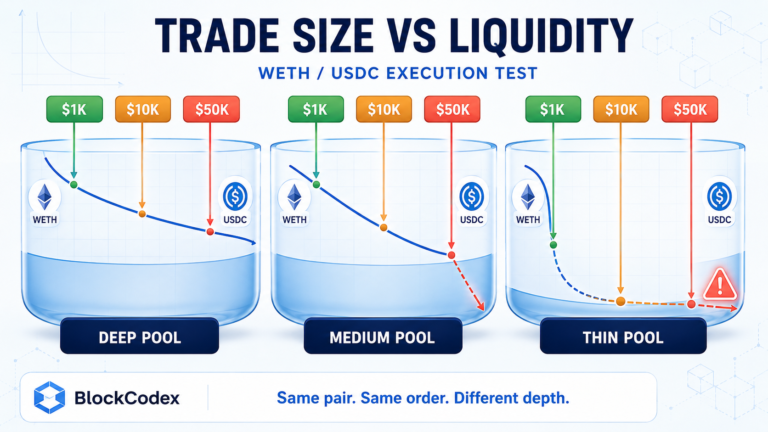
On a liquid BTC market, an order of that size may execute close to the displayed price with little visible disruption. On a thin altcoin market, the same order can consume several price levels, produce significant slippage and leave the trader with a much worse average execution price.
The difference is market depth.
Market depth Crypto describes how much buying and selling interest is available at different price levels around the current market price. It helps answer a question that volume, market capitalization and TVL cannot answer on their own:
How much capital can this market absorb before the price begins to move materially?
That question matters to more than professional traders. An investor evaluating a small-cap token, a DeFi pool or an exchange listing needs to know whether the displayed price is realistically available for the position they intend to trade.
A token may be quoted at $2.00, but that does not mean an investor can sell an entire position at $2.00. The visible price usually reflects the best current quote or most recent transaction. The remaining position must find buyers deeper in the market.
Market depth reveals how far the price may need to travel to find them.
Table of Contents
Market Depth Is a Curve, Not a Single Number
One reason market depth is frequently misunderstood is that investors look for a single figure.
They may see $500,000 of liquidity, $20 million in daily volume or a narrow spread and assume the market is deep. None of those figures describes the entire execution environment.
Market depth changes with distance from the current price.
A market may have:
- $50,000 of bids within 0.25% of the current price.
- $180,000 within 1%.
- $600,000 within 5%.
- Several million dollars much further away.
All of those figures can be correct at the same time.
The relevant number depends on the size of the trade and the maximum price movement the investor is willing to accept. A trader placing a $5,000 order may care about liquidity within 0.25%, while a fund attempting to execute $1 million may need to examine several percentage points of the book.
Coinbase describes a depth chart as a cumulative representation of bid and ask orders across a range of prices, while Kraken defines bid and ask depth through the accumulated volume available at increasingly distant price levels.
The shape of that curve matters more than the headline number.
A deep market has meaningful liquidity close to the current price. A shallow market forces even moderate orders to travel further through the available bids or asks.
How an Order Book Creates Market Depth
On a centralized exchange or an order-book DEX, market depth comes from limit orders.
Buyers place bids specifying the price they are willing to pay. Sellers place asks specifying the price they are willing to accept. These orders remain in the book until they are filled, cancelled or expire.
The highest bid and lowest ask form the top of the book.
Suppose a token has the following simplified sell side:
| Ask Price | Tokens Available | Cumulative Tokens |
|---|---|---|
| $10.01 | 1,000 | 1,000 |
| $10.03 | 2,000 | 3,000 |
| $10.06 | 4,000 | 7,000 |
| $10.12 | 8,000 | 15,000 |
A market buy for 500 tokens could execute entirely at $10.01. A larger order for 7,000 tokens would consume the first three price levels and receive an average price above the initial best ask.
The quoted price did not suddenly become inaccurate.
It was only available for a limited quantity.
This is the practical meaning of market depth: the book shows how much inventory exists at each price before the next part of the order must execute at a less favorable level.
Market Depth Crypto Analysis Begins With Position Size
A common mistake is asking whether a token has “good liquidity” without first defining the intended trade size.
Liquidity is relative.
A market may be perfectly usable for a $2,000 position and completely unsuitable for a $200,000 position. The same order book can therefore be deep for one investor and shallow for another.
A useful market depth crypto analysis should begin with three numbers:
- The intended trade size.
- The depth available close to the current price.
- The expected average execution price.
The investor can then estimate whether the position fits the market.
Consider two hypothetical assets with the same $10 million daily trading volume:
| Metric | Market A | Market B |
|---|---|---|
| Daily volume | $10 million | $10 million |
| Bid depth within 1% | $1.2 million | $80,000 |
| Ask depth within 1% | $1.1 million | $65,000 |
| Bid-ask spread | 0.08% | 0.70% |
| Likely execution for a $100,000 buy | Limited impact | Several price levels consumed |
The volume figures look identical, but the execution conditions are very different.
Market A has enough nearby inventory to absorb the order. Market B may have traded substantial volume during the day, yet it does not currently offer enough sell-side depth to execute the same order efficiently.
That is why volume should never be used as a substitute for depth.
Market Depth vs Volume, Spread and Liquidity
These terms describe related parts of market structure, but they are not interchangeable.
| Metric | What It Measures | What It Does Not Reveal Alone |
|---|---|---|
| Trading volume | Completed transactions during a period | Current liquidity available for the next trade |
| Bid-ask spread | Distance between the best bid and best ask | Quantity available behind those quotes |
| Market depth | Cumulative bids and asks across price levels | Whether orders will remain in the book |
| Liquidity | Overall ability to trade efficiently | The exact distribution at each price level |
| TVL | Capital deposited in protocols or pools | Executable liquidity near the current price |
A narrow spread can coexist with shallow depth. An exchange may display attractive best quotes, but only a small quantity may be available at those prices.
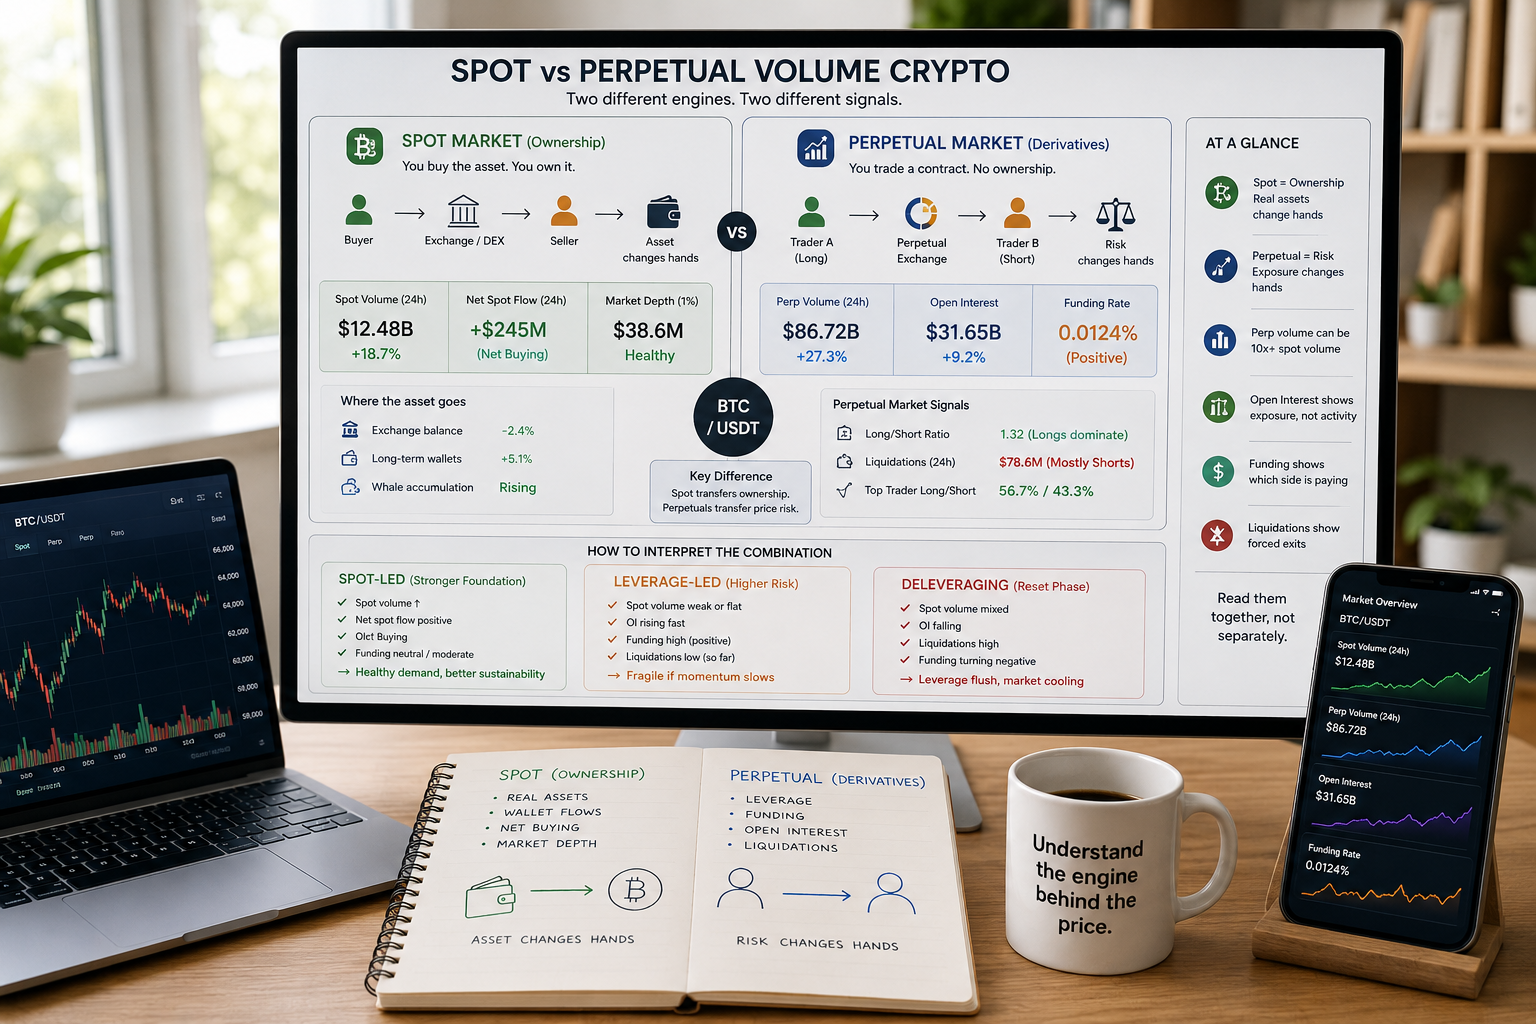
High volume can also coexist with weak depth. The same capital can trade repeatedly, market makers can generate rapid turnover, and activity may be concentrated in short periods rather than available consistently.
For a broader explanation of these distinctions, see BlockCodex’s guide to Liquidity in Crypto Markets.
Market depth is valuable because it moves the analysis from historical activity toward present execution capacity.
1. Useful Depth Sits Close to the Current Price
The first sign of a genuinely deep market is not the total size of the order book.
It is how much liquidity exists near the midpoint.
Orders positioned 15% or 20% away may make the full book look impressive, but they provide little protection against short-term price impact. What matters for normal execution is the capital available within a realistic trading range.
Investors can compare cumulative depth within bands such as:
- 0.25% from the midpoint.
- 0.5% from the midpoint.
- 1% from the midpoint.
- 2% from the midpoint.
- 5% from the midpoint.
There is no universal best band. The appropriate range depends on volatility, trade size and the type of asset being analyzed.
For major trading pairs, even a 1% movement may be meaningful. For a volatile small-cap token, the book may naturally be wider, but that does not make the execution risk disappear.
Depth far from the market price is potential liquidity.
Depth close to the market price is usable liquidity.
2. Bid Depth and Ask Depth Should Be Read Separately
A market can be deep on one side and fragile on the other.
Large bid depth means the market currently has more visible buying interest below the price. Strong ask depth means more tokens are available for buyers without forcing the price sharply upward.
An imbalance can change execution conditions.
If ask depth is thin while bid depth is strong, a moderate market buy may push the price upward quickly. If bids are thin, a large seller may have to accept increasingly lower prices to exit.
This does not automatically predict the next market direction. Orders can be changed or cancelled, and visible imbalances may disappear before a trade reaches them.
The imbalance is still useful because it shows where current absorption capacity is concentrated.
For investors, the key questions are practical:
- How much can I buy before crossing several ask levels?
- How much can I sell before consuming the nearby bids?
- Is my entry easier than my eventual exit?
- Would several investors leaving at once overwhelm the same side of the market?
A market that is easy to enter but difficult to exit is not as liquid as it first appears.
3. A Deep Book Must Persist, Not Merely Appear
An order book is a live set of intentions, not a permanent inventory.
Limit orders can be added, modified or cancelled. A large wall visible now may disappear when the price approaches it. New orders may also enter and replenish liquidity after trades occur.
A single screenshot therefore provides limited evidence.
A better market depth crypto review examines whether liquidity persists over time. Does similar depth remain available during different sessions? Does the book replenish after trades? Do large walls regularly vanish before execution?
Binance’s official explanation of order books warns that large buy and sell walls can create a false impression because orders can be placed and removed easily.
This does not mean every cancelled order is manipulative. Market makers constantly adjust quotes as volatility, inventory and external prices change.
The point is that displayed depth should be treated as conditional.
Real depth reveals itself through repeated execution and replenishment, not through one dramatic wall.
4. Trade Impact Is More Useful Than the Book’s Appearance
Order books can look complex while still failing to answer the investor’s real question.
A more practical test is to simulate the intended trade.
For a market buy, estimate how much of each ask level would be consumed and calculate the expected average price. For a market sell, repeat the process across available bids.
This reveals three important values:
- The average execution price.
- The percentage impact relative to the initial quote.
- The remaining depth after the trade.
Coinbase notes that market orders consume existing limit orders and may execute at progressively less favorable prices when insufficient liquidity exists at the top of the book.
The visible price is therefore less important than the price available for the full position.
An investor planning a $50,000 purchase should analyze a $50,000 execution, not admire a chart designed around a $500 top-of-book quote.
5. Depth Must Be Checked on the Specific Venue
Crypto liquidity is fragmented.
BTC may trade on dozens of centralized exchanges, derivatives venues and decentralized platforms. A token can also have several pairs against USDT, USDC, BTC, ETH or local currencies.
The depth on one venue does not automatically exist on another.
A token may show strong aggregate volume across the market while the exchange available to a particular investor remains thin. A DEX aggregator may find liquidity across several pools, while a direct interaction with one pool produces a worse result.
This fragmentation makes broad liquidity claims difficult.
When examining market depth, specify:
- The exchange or protocol.
- The exact trading pair.
- The quoted currency.
- The relevant network.
- The pool or fee tier.
- The time of observation.
Depth belongs to a market venue.
It does not belong to the token in the abstract.
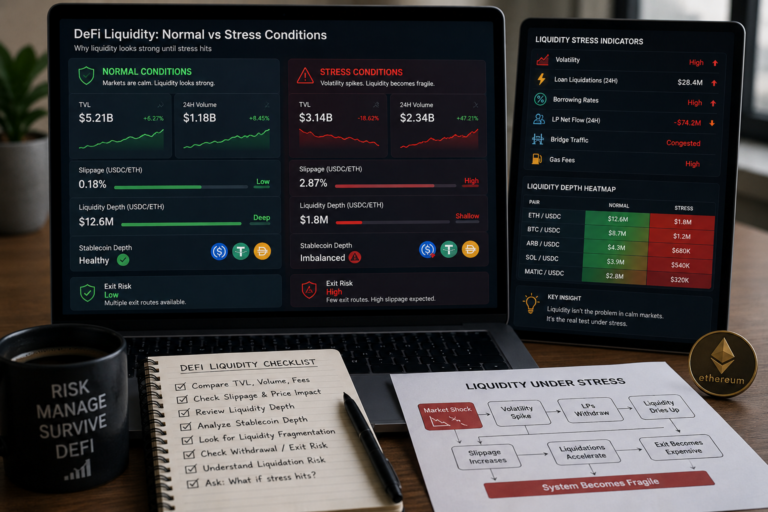
6. Depth Should Survive Stress
A calm order book shows what liquidity providers are willing to quote under normal conditions.
Stress reveals whether that liquidity is dependable.
During rapid price movements, market makers may widen spreads, reduce order sizes or remove quotes while they manage inventory and volatility. Traders who measured depth during a quiet session may discover that far less liquidity is available when they actually need to exit.
This is why market depth should be observed during:
- Sharp price moves.
- Token unlocks.
- Major announcements.
- Exchange incidents.
- Liquidation events.
- Broad market sell-offs.
- Periods of low trading activity.
A market that appears deep only when nobody urgently needs liquidity is not necessarily resilient.
The real test is how the market absorbs simultaneous demand for execution.
This is particularly important for small tokens. An investor may be able to sell under normal conditions, yet struggle when many holders respond to the same negative event at once.
Market depth is not only an entry metric.
It is a stress metric.
7. Genuine Volume Should Replenish Depth
Volume and market depth become more meaningful when they reinforce each other.
Suppose a large sell order consumes several bid levels. In a healthy active market, new buyers may enter, market makers may replace quotes and the book may begin rebuilding.
This is replenishment.
A market with high volume but poor replenishment can still become unstable. Activity may exist, but the available liquidity does not recover quickly enough after aggressive orders.
A stronger market usually shows:
- Regular two-sided trading.
- Repeated refilling of consumed levels.
- Reasonably stable spreads.
- Depth that returns after moderate orders.
- Activity distributed across multiple participants.
By contrast, suspicious volume may appear without corresponding liquidity quality. Trades can be repetitive, concentrated or disconnected from the execution available to ordinary participants.
For a deeper investigation of this distinction, see How to Identify Fake Volume in Crypto.
A credible market does not only report activity.
It repeatedly demonstrates its ability to absorb it.
How Market Depth Works on a DEX
Market depth on an automated market maker does not appear as a traditional list of bids and asks.
Instead, liquidity is held inside smart-contract pools, and the pool’s pricing curve determines how the trade changes the relative token balances.
The practical result is similar: larger trades consume more available liquidity and create greater price impact.
Uniswap distinguishes price impact—the price movement caused directly by the trade—from slippage, which is the difference between the expected and final execution result. It also notes that larger pools generally produce lower price impact for the same trade size.
For an AMM, market depth depends on factors such as:
- Pool reserves.
- Liquidity close to the current price.
- Concentrated liquidity ranges.
- Fee tier.
- Number of available pools.
- Trade routing.
- Token transfer mechanics.
- Competing liquidity on other DEXs.
Headline TVL is not enough.
A concentrated-liquidity pool can have substantial capital overall while only part of that capital is active near the current trading price. Uniswap v3 and v4 allow liquidity providers to allocate capital within chosen price ranges, meaning the distribution of liquidity matters alongside its total value.
For traders, the best practical measure is the quoted output for the intended trade size.
The pool either offers acceptable execution or it does not.
Market Depth and Slippage Are Connected but Different
Market depth describes the liquidity available across prices.
Slippage describes the difference between the expected execution and the result ultimately received.
Weak depth increases the likelihood of slippage because the order must consume more distant price levels. However, slippage can also arise because the market changes between submission and execution.
On a centralized exchange, a market order may sweep through the book immediately. On a DEX, block confirmation delays, competing transactions and route changes can affect the final outcome.
This distinction is important:
- Price impact comes from the trade itself consuming liquidity.
- Slippage includes the difference between the expected and final execution.
- Market depth helps determine how sensitive the market is to the trade size.
BlockCodex explains the execution layer in What Is Slippage in Crypto and Why It Matters?.
These metrics should be read together rather than treated as separate dashboard statistics.
A Practical Market Depth Crypto Framework
An investor does not need institutional software to make a better depth assessment.
Start with the intended position rather than the token.
Define the Trade
Specify whether the transaction is a buy or sell, the exact venue, the pair and the intended size.
Examine Nearby Depth
Measure cumulative bids or asks within relevant price bands around the midpoint.
Estimate Average Execution
Determine how many levels the full order would consume and calculate the likely average price.
Compare Both Sides
Review whether entry and exit conditions are balanced or whether one side is materially weaker.
Observe the Book Over Time
Check whether depth persists, disappears or replenishes after trades.
Compare Venues
Determine whether stronger liquidity exists on another exchange, pair, network or pool.
Repeat Under Stress
Review how depth behaves during volatility rather than relying only on calm-market conditions.
The final output should be a practical conclusion, such as:
The market can absorb my planned entry within an acceptable range, but sell-side depth is weaker and deteriorates quickly beyond 1%, so the position should remain small and may require a staged exit.
That conclusion is more useful than simply calling the token liquid or illiquid.
Common Market Depth Mistakes
Looking Only at the Bid-Ask Spread
A narrow spread can be supported by very small orders. It does not reveal how much size exists behind them.
Trusting One Large Wall
The order may be cancelled or repositioned before execution.
Using Daily Volume as a Depth Estimate
Volume reflects past transactions, while depth reflects currently available orders or pool liquidity.
Ignoring the Trade’s Own Size
Liquidity must be evaluated relative to the intended position.
Combining Every Venue Into One Figure
The investor may not have access to all of that liquidity, and execution can vary significantly across pairs and platforms.
Assuming TVL Equals DEX Depth
Only liquidity available along the relevant trading route and price range can support the swap.
Checking Depth Only During Calm Markets
Liquidity often changes precisely when many traders need it most.
Final Thoughts
Market depth in crypto reveals what lies behind the displayed price.
It shows whether a market can absorb meaningful buying or selling without forcing execution through progressively worse levels. That makes it one of the most practical measures of liquidity, especially for investors evaluating small-cap tokens, fragmented markets and DeFi pools.
The strongest analysis does not stop at the visible order book. It considers the intended trade size, nearby bid and ask depth, persistence, replenishment, venue fragmentation and behavior during stress. On a DEX, the same logic applies through pool liquidity, routing and price impact rather than a traditional ladder of orders.
A market can have high volume and still be shallow. It can show a narrow spread and still offer poor execution. It can display large walls that disappear when the price approaches.
The question that matters is not how active the market appears.
It is how much real trading pressure the market can absorb before the price has to move.
That is what market depth measures.