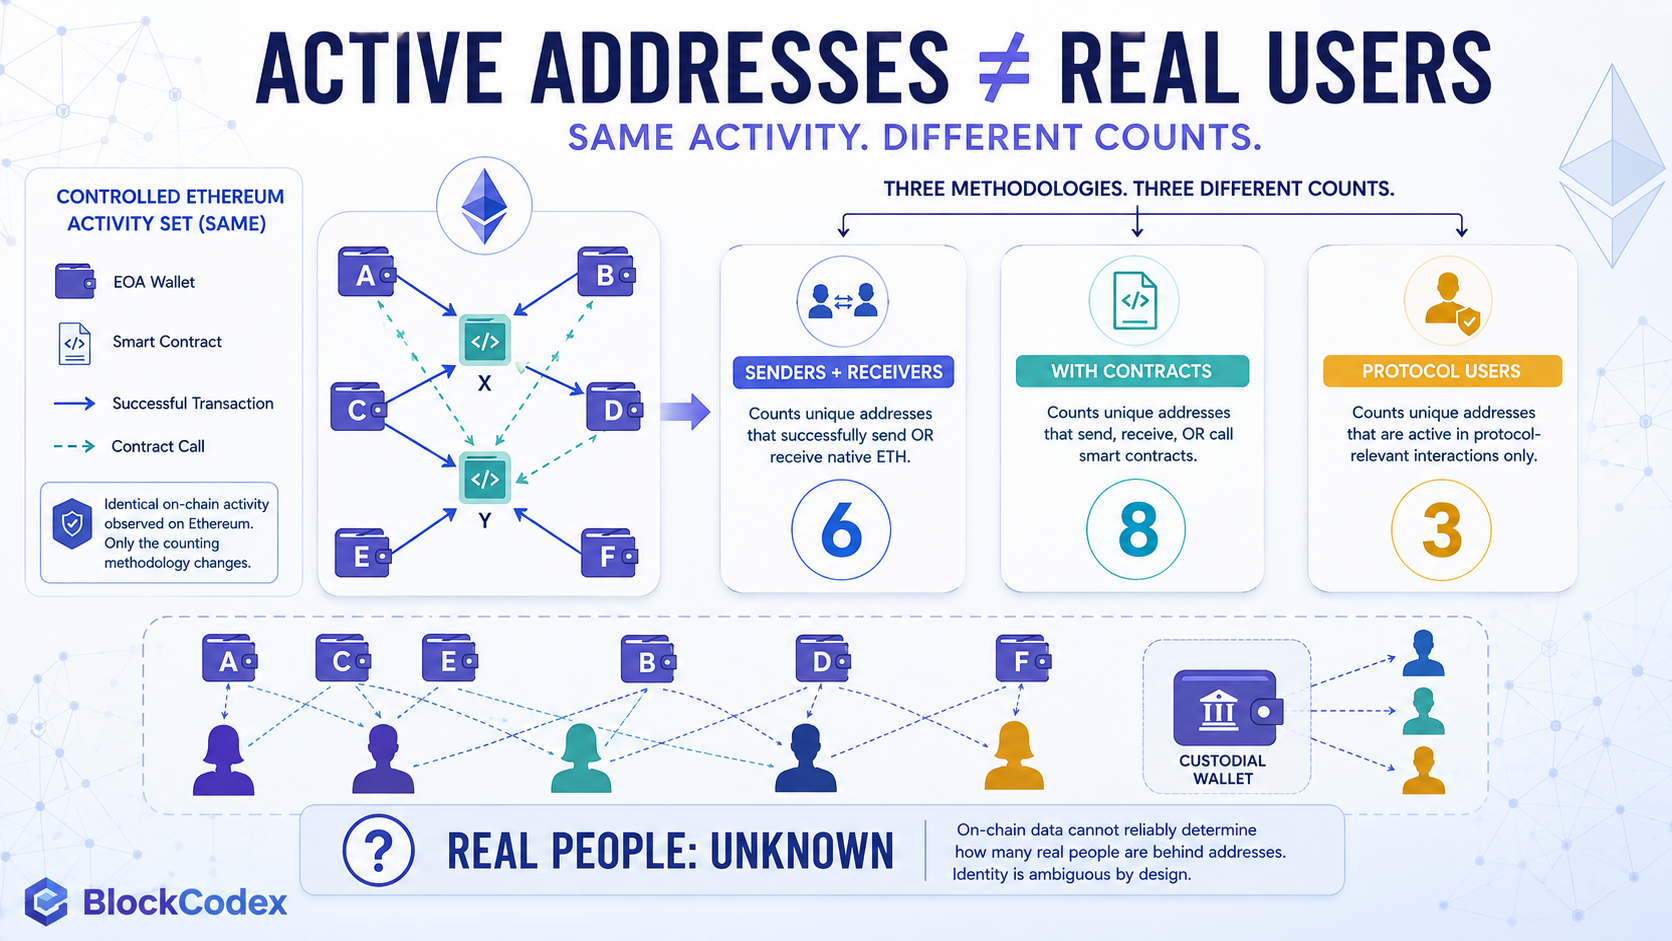
A blockchain can attract hundreds of thousands of addresses during a launch, incentive campaign or speculative cycle. That number looks impressive until most of those addresses disappear a few weeks later.
Acquisition shows that an ecosystem can attract attention. Retention shows whether it gives users a reason to return.
Measuring blockchain user retention requires more than comparing this month’s active-address count with last month’s. The useful question is whether the same addresses come back after their first qualifying interaction, measured against a clearly defined starting population.
This guide builds a practical framework around that question. It explains cohort retention, returning-user share and rolling retention, then applies the formulas to one controlled dataset so the denominator never disappears behind the percentage.
Blockchain User Retention: The Short Answer
Blockchain user retention measures the proportion of a defined group of addresses that returns and performs another qualifying on-chain action after its first active period.
The simplest cohort formula is:
Month N retention = addresses from the original cohort active in Month N ÷ original cohort size × 100
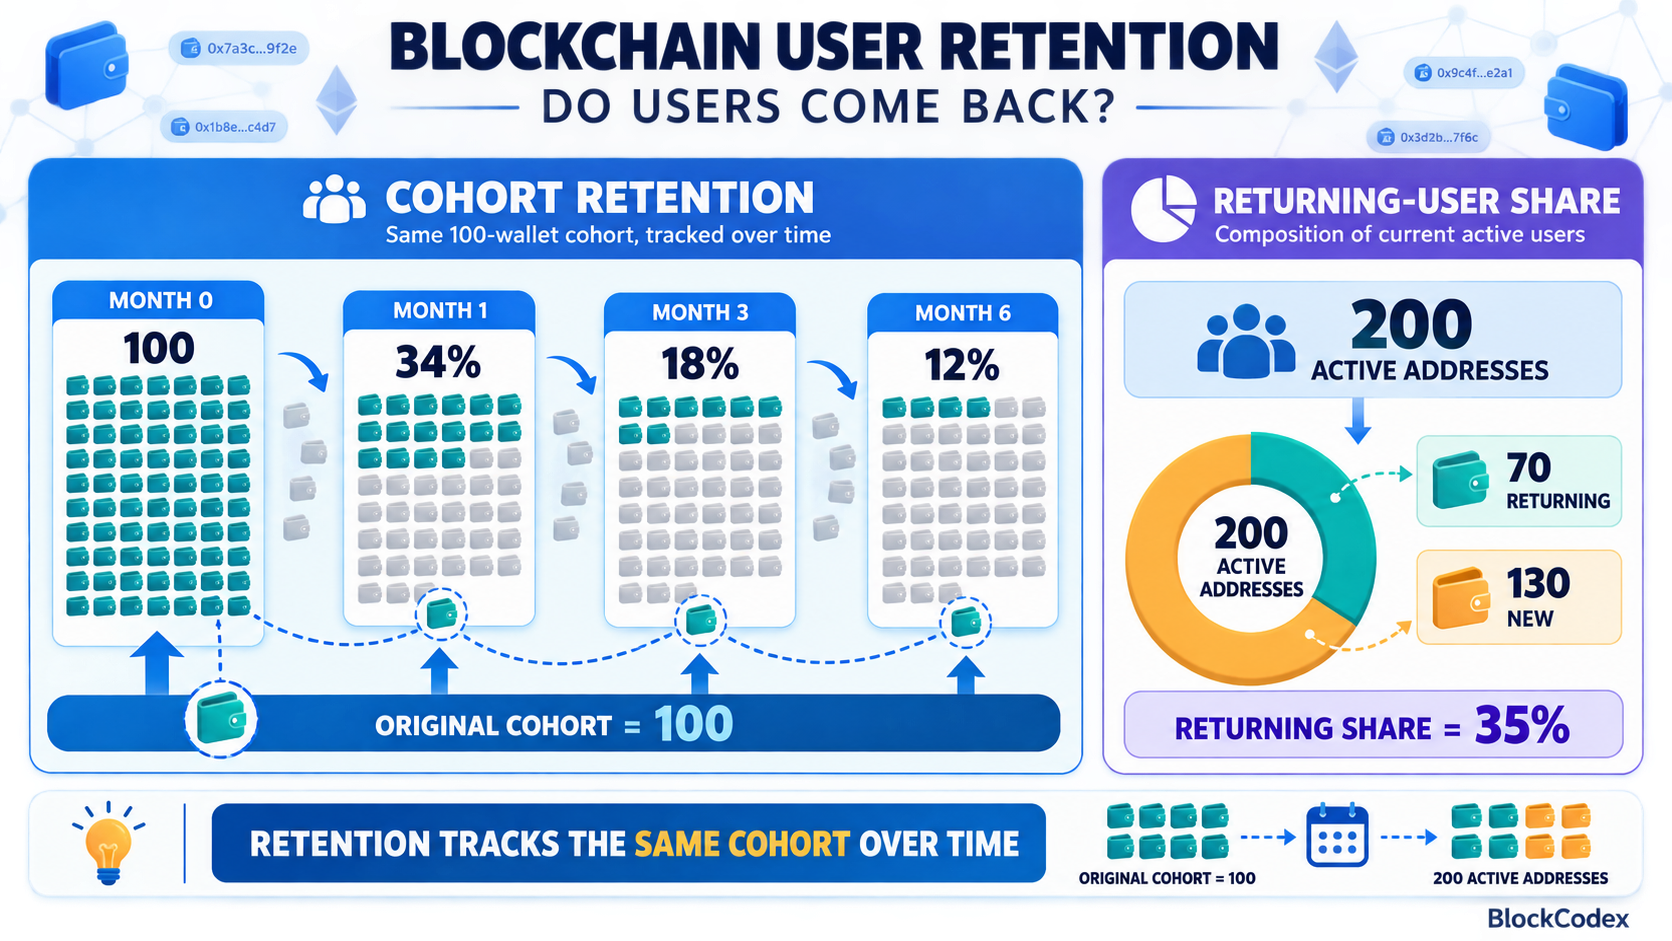
If 1,000 addresses first use a protocol in January and 240 of those same addresses return in February, Month 1 retention is 24%. The denominator remains the original 1,000-address January cohort, not February’s total active-address count.
That denominator is what makes retention different from general activity. A network may add many new addresses while retaining very few earlier ones, allowing total activity to grow even as user loyalty weakens.
Why Retention Is More Informative Than an Active-User Total
An active-user chart combines several populations. It can include first-time addresses, recurring users, reactivated wallets, bots and accounts created for incentives. If the total rises, the chart does not show which group caused the increase.
Retention separates acquisition from continued use. It asks whether the addresses acquired in a specific period are still participating one, three or six months later.
This makes retention a narrower signal than the broader framework in BlockCodex’s analysis of crypto ecosystem growth. Ecosystem growth depends on users, developers, liquidity, infrastructure and applications working together. Retention isolates one part of that system: whether initial activity becomes repeat behavior.
A chain with modest acquisition and improving retention may be building a more stable base. Another chain can report rapid active-address growth while constantly replacing users who never return.
Define “Active” Before Calculating Retention
The formula is useless if the qualifying activity is vague.
At the network level, an active address might mean a unique transaction sender during a day, week or month. At the application level, it could mean a wallet interacting with selected business-relevant contracts. A lending protocol may count deposits and borrows, while a DEX may count swaps through approved router or pool contracts.
Before building a cohort, document five decisions:
| Methodology Choice | Question to Answer |
|---|---|
| Scope | Are you measuring an entire chain, one application or one contract set? |
| Qualifying action | Does any successful transaction count, or only economically relevant interactions? |
| Address role | Are you counting senders, signers, receivers or every address touched by execution? |
| Time unit | Are cohorts daily, weekly or monthly? |
| Identity rule | How will contract accounts, custodians, bots and known Sybil clusters be treated? |
The same definition must be applied when the address enters the cohort and when its later activity is tested. Counting any transaction at acquisition but only fee-generating actions at retention would mix two different populations.
Addresses also remain proxies rather than verified people. One person can control several wallets, while a custodial address can represent many customers. The retention result should therefore be described as retained addresses unless an additional identity model supports a stronger claim.
Three Retention Metrics That Answer Different Questions
“Retention rate” can refer to several calculations. They should not be merged because their denominators and business questions differ.
1. Cohort Retention
Cohort retention starts with addresses first seen during the same period. It then measures what percentage of that original group is active in each later period.
Cohort retention in Month N = returning addresses from the cohort in Month N ÷ initial cohort size
This is the cleanest metric for asking whether newly acquired addresses become repeat users. The denominator stays fixed, which makes the curve comparable across the cohort’s lifetime.
2. Returning-User Share
Returning-user share examines the composition of the current period rather than the survival of one acquisition cohort.
Returning-user share = previously seen active addresses this period ÷ all active addresses this period
If April contains 200 active addresses and 70 were already active before April, the returning-user share is 35%. The denominator is April’s active population, not the size of any original cohort.
This metric answers whether current activity is driven mainly by established or newly acquired addresses. It cannot show how well a specific January, February or March cohort survived.
3. Rolling Retention
Rolling retention counts an address as retained if it returns at least once on or after a chosen point.
Day 30 rolling retention = cohort addresses active on Day 30 or any later day ÷ original cohort size
It is more forgiving than exact-period retention. A wallet inactive in Month 1 but returning in Month 3 fails exact Month 1 retention, yet it can still qualify under a rolling measure.
Rolling retention is useful for products used irregularly, such as staking, governance or occasional settlement. It should be labelled clearly because its percentage will normally be higher than exact-period retention for the same cohort.
The Public Cohort Framework Used by Token Terminal
Token Terminal’s cohort analysis documentation provides a practical public reference for this methodology. It tracks first-time users by month and measures the portion that remains active in each subsequent month.
The provider’s methodology article defines monthly active users as unique addresses transacting with a project’s business-relevant smart contracts during a calendar month. Its table begins with the initial cohort size, sets Month 0 equal to that full cohort and calculates Month 1 onward against the same starting population.
Token Terminal also warns that business models change how the result should be interpreted. Its example contrasts a liquid-staking product, where users may deposit and then remain passive, with a Layer 2 network that can support frequent application interactions. Lower monthly activity does not automatically mean the staking product failed to retain economic relationships.
The dashboard is useful because it makes the denominator visible. Access to specific data views or the API may depend on Token Terminal’s current product access, but the published methodology is sufficient to reproduce the framework with another address-level dataset.
Controlled Cohort Test: The Denominator in Practice
Consider a hypothetical blockchain application that acquires 100 first-time active addresses in January. The dataset is controlled and illustrative; it is not a live measurement of any named chain or protocol.
| January Cohort | Active Addresses From That Cohort | Retention Calculation | Retention Rate |
| Month 0 — January | 100 | 100 ÷ 100 | 100% |
| Month 1 — February | 34 | 34 ÷ 100 | 34% |
| Month 2 — March | 22 | 22 ÷ 100 | 22% |
| Month 3 — April | 18 | 18 ÷ 100 | 18% |
| Month 6 — July | 12 | 12 ÷ 100 | 12% |
The denominator stays at 100 because the question is: what proportion of the January acquisition cohort returned in each later month?
Changing the denominator to the total number of active addresses in April would no longer produce January cohort retention. It would produce a share of April activity.
Now assume April has 200 active addresses in total:
- 18 returned from the January cohort.
- 22 returned from the February cohort.
- 30 returned from the March cohort.
- 130 are first-time active addresses in April.
April therefore contains 70 previously seen addresses and 130 new addresses.
April returning-user share = 70 ÷ 200 = 35%
Both 18% and 35% are correct, but they describe different things. The 18% figure measures Month 3 survival of the January cohort. The 35% figure measures how much of April’s activity came from any previously seen address.
This distinction prevents a common analytical mistake: calling every ratio involving returning addresses “retention.”
How to Build a Blockchain Retention Cohort
The calculation can be built from address-level transaction or contract-interaction data. The specific query syntax changes by dataset, but the workflow remains stable.
Step 1: Select the Population
Choose the chain or protocol and list the events that qualify as genuine use. A network-level analysis may use successful transaction signers, while a protocol study should normally filter for relevant contracts and functions.
Avoid including token spam, unsolicited transfers or purely operational contract activity if they do not represent the behavior being studied.
Step 2: Find Each Address’s First Active Period
For every qualifying address, identify the earliest day, week or month in which it appears. That period assigns the address to its acquisition cohort.
An address should belong to one first-use cohort only. Reappearing later makes it retained or reactivated; it does not create a second acquisition event.
Step 3: Deduplicate Within Each Period
An address making 100 transactions in one month is still one active address for that month’s cohort table. Retention measures whether the account returned, not how frequently it transacted after returning.
Transaction frequency can be analyzed separately as an engagement metric.
Step 4: Join Later Activity Back to the Original Cohort
For each cohort, count how many original addresses appear in Month 1, Month 2 and later periods. Divide every count by the initial cohort size.
The conceptual query is:
first_active_period = MIN(period) for each address
cohort_size = COUNT(DISTINCT address) by first_active_period
retained_addresses = COUNT(DISTINCT address) by first_active_period and later_period
retention_rate = retained_addresses / cohort_size
Step 5: Keep Incomplete Cohorts Out of Mature Comparisons
A cohort acquired last month cannot have a six-month retention rate. Its later cells should remain blank rather than being treated as zero.
When comparing Month 6 retention across cohorts, include only cohorts old enough to have reached Month 6.
Step 6: Label Reactivated Addresses
An address may return after several inactive periods. Exact-period retention records zero during the inactive months and counts the address again when it returns.
Separating continuously retained and reactivated users can reveal whether an ecosystem creates regular habits or occasional reasons to come back.
The Denominator Errors That Distort Retention
Most misleading retention charts do not use incorrect arithmetic. They use a denominator that answers a different question.
Dividing by Current Active Users
Current-period active addresses are the denominator for returning-user share, not cohort retention. A large acquisition campaign can expand the current population and make the returning share fall even when older cohorts behave normally.
Dividing by All Addresses Ever Created
Total-address counts include inactive, empty, custodial and potentially spam-related accounts. They do not form a meaningful population for product retention.
Using Transactions Instead of Addresses
Transactions measure frequency. One bot or power user can generate thousands, causing transaction-based “retention” to rise even if the number of returning addresses falls.
Changing the Qualifying Event
If Month 0 counts any interaction but Month 1 counts only revenue-generating actions, the curve reflects a filter change as well as behavioral change.
Combining Cohorts of Different Ages
Recent cohorts have not had time to reach later periods. Averaging them with mature cohorts creates artificial zeros or removes long-term behavior from the comparison.
Daily, Weekly or Monthly Retention?
The appropriate interval depends on how often a healthy user should interact.
Daily retention can make sense for games, social applications and high-frequency trading products. Weekly periods may suit DEXs, wallets and consumer applications with recurring but non-daily use. Monthly cohorts are often better for lending, staking, governance and broader ecosystem analysis.
The interval should reflect expected product behavior, not whichever frequency produces the most attractive chart. Token Terminal’s comparison between staking and Layer 2 cohorts illustrates why the same monthly standard can imply different levels of engagement across business models.
For ecosystem-wide analysis, monthly cohorts usually reduce day-to-day noise. They also allow time for users to explore several applications, bridge funds, trade, borrow or make payments within the network.
What a Healthy Retention Curve Looks Like
There is no universal “good” blockchain retention percentage. A payment network, NFT marketplace, DEX, lending market and staking protocol create different interaction rhythms.
The shape of the curve is often more useful than one benchmark. Most cohorts decline sharply after Month 0 because exploratory and incentive-driven addresses leave. A healthier pattern begins to flatten as a smaller core group continues returning.
Useful signals include:
- Later cohorts retaining better than earlier cohorts.
- A stable long-term floor rather than continued decline toward zero.
- Retention remaining after rewards or points campaigns end.
- Returning addresses spreading across several applications.
- Retained cohorts generating fees, liquidity or economically meaningful activity.
Warning patterns include large acquisition cohorts followed by unusually weak Month 1 retention, repeated spikes around airdrops and retention that collapses as soon as incentives decline.
Token Terminal’s historical Synthetix example linked lower cohort retention to the period of the Optimism Quests incentive campaign. The example does not prove that every departing address was a farmer, but it shows how cohort data can test whether campaign-driven acquisition persisted.
Retention Quality Matters as Much as Retention Rate
An address can return without creating much economic value. Bots, arbitrage systems and reward farmers can be highly persistent, so a strong retention rate is not automatically proof of broad human adoption.
Retention should be compared with:
| Confirmation Signal | What It Adds |
| Fees or revenue | Whether returning activity creates economic demand |
| Stablecoin activity | Whether users keep usable capital inside the ecosystem |
| Liquidity depth | Whether retained users can enter and exit efficiently |
| Application breadth | Whether retention depends on one product or several |
| Transaction value | Whether activity is economically meaningful or mostly dust |
| Incentive schedule | Whether users remain after rewards decline |
| Cohort concentration | Whether a small wallet cluster dominates the result |
Stablecoins deserve particular attention because they allow users to remain active without exiting into volatile assets or bridging to another chain. BlockCodex’s analysis of stablecoins and ecosystem growth explains how settlement liquidity can support trading, lending, payments and capital retention across applications.
Developer activity provides another layer of confirmation. Builders create the products that give users reasons to return, but repositories alone do not prove adoption. The stronger signal appears when the development pipeline described in BlockCodex’s developer activity analysis converts releases into retained usage.
How Incentives Change the Retention Story
Incentives can acquire users quickly, but cohort analysis reveals whether those users stay after the reward becomes less attractive.
Measure cohorts before, during and after the campaign. Compare Month 1 and Month 3 retention at the same maturity, then add fees, transaction value and liquidity supplied by each group.
Several outcomes are possible. A campaign may attract a large low-retention cohort yet still introduce a smaller group of durable users. It may retain many wallets that continue only because rewards remain active. It may also fail completely, with activity disappearing as soon as eligibility is secured.
The correct conclusion should separate acquisition efficiency from retention quality. A campaign that creates 100,000 new addresses and retains 5% may contribute more long-term users than one that acquires 5,000 and retains 40%, but it may have done so at a much higher incentive cost.
A Practical Blockchain User Retention Scorecard
| Question | Stronger Evidence | Warning Signal |
| Are cohorts returning? | Month 1 and Month 3 rates stabilize or improve | Most cohorts approach zero rapidly |
| Is retention organic? | Users remain after incentives decline | Retention tracks rewards almost exactly |
| Is activity economically meaningful? | Fees, value and liquidity accompany returning use | Repeat activity consists mainly of dust or spam |
| Is use diversified? | Retained addresses use several applications | One campaign or contract drives the result |
| Are later cohorts improving? | Product changes lead to better comparable cohorts | Acquisition grows while cohort quality falls |
| Is the methodology stable? | Scope, event filters and denominators are documented | Definitions change without restating history |
| Does the interval fit the product? | Measurement matches expected usage frequency | Daily activity is demanded from low-frequency products |
The scorecard does not convert retention into a universal ranking. It keeps the analysis focused on repeat behavior, measurement quality and economic context.
What Blockchain User Retention Cannot Prove
Retention cannot confirm that every address represents a different person. It cannot show whether retained activity is profitable for a protocol, whether a token is fairly valued or whether an ecosystem will continue growing.
It can also miss valuable users whose activity moves off-chain through exchanges, custodians or application-managed accounts. Cross-chain users may return to the same product through a different wallet or network and appear as newly acquired addresses.
These limitations do not invalidate the metric. They define its proper role: blockchain user retention is evidence of repeated qualifying activity among observable addresses under a stated methodology.
Final Thoughts
Blockchain user retention turns ecosystem growth from a headcount into a behavioral question. Instead of asking how many addresses appeared, it asks whether the same addresses found enough value to return.
The most reliable starting point is cohort retention. Assign each address to its first qualifying period, keep the initial cohort as the denominator and measure how many members reappear in later periods. Use returning-user share to understand current activity composition and rolling retention when the product naturally supports irregular use.
The controlled example shows why these metrics should not be mixed. The January cohort had 18% Month 3 retention, while April’s returning-user share was 35%. Both figures were valid because they answered different questions with different denominators.
Retention becomes more meaningful when it survives the end of incentives and aligns with fees, stablecoin activity, liquidity and useful applications. It does not prove that every address is one human, but it reveals something active-user totals cannot: whether an ecosystem is building repeatable demand or continually replacing users who leave.